
https://www.collectiveray.com/wordpress-debug
In fact, enabling WordPress debug will help you in 2 ways.
- PHP errors: It shows errors caused by any PHP functions
- Deprecated functions: These are functions that might have used in previous versions of code, but have been recently marked as not to be used anymore. This will help you to find a replacement function to use instead.
In this post, let’s take a look at various WordPress debugging constants and how to turn on error logging on your installation or website…
WordPress Debug Settings
1. Enable WordPess Debug with WP_DEBUG
The most important PHP constant that can be used to enable debugging mode on your site is WP_DEBUG.
By default, this PHP constant is set to false. It will be shown as follows in your wp-config.php file.
define( 'WP_DEBUG', false );
In order to turn on logging, all you need to do is to set WP_DEBUG to true.
See the code below.
define( 'WP_DEBUG', true );
Below are a couple of things, you’ll need to keep in your mind before enabling WordPress debug.
- Be careful before making any changes to your wp-config.php file because it is the most important file in your installation that can be used to configure database access, enhance performance and improve security. Making a small mistake in the configuration can result in your site becoming inaccessible
- Make sure you don’t enable WordPress debugging on a live site. As we said before, crucial information can be revealed, besides the fact that leaving WordPress debugging enabled will create performance problems because it results in significant overhead
Recommend Reading: How to backup WordPress natively or with a plugin
Now that we've enabled the setting for WordPress debugging we'll need to look at the output of the debugging commands. To do this, it is best that we enable the WordPress debugging log file.
This can be done by enabling the next setting in wp-config.php.
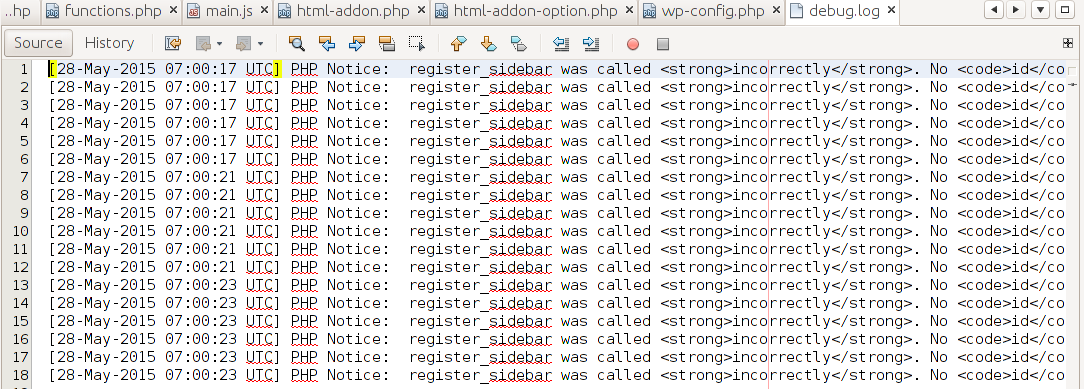
2. Log Errors to debug.log with WP_DEBUG_LOG
To be able to review any WordPress debugging errors, notices or any other output, we'll need to look at the WordPress debug file. Possibly you will need to send this file to any vendors or WordPress developers that you work with.
To generate the WordPress debugging log file, you’ll need to turn on ‘WordPress debug logging’ using the WP_DEBUG_LOG setting. This constant essentially forces WordPress to write debugging outputs to a log file.
What this PHP constant does is it saves all error notices in a debug.log file located in the ‘wp-content’ directory setting, so you can review such notices/errors whenever you need.
Note that the WP_DEBUG_LOG setting works in conjunction with WP_DEBUG constant i.e. the WP_DEBUG must be enabled for the WP_DEBUG_LOG setting to take effect.
Here is how to enable debug logging to the debug.log file. Simply add the following code to your wp-config.php file.
define( 'WP_DEBUG_LOG', true);
Once it is set to true, all of your themes and plugins errors will be tracked and saved in the debug.log file.
There is also the possibility to set a different file by using a small variation in this setting. For example, if you'd like to set a different location or name for the log file, you can use the following:
define( 'WP_DEBUG_LOG', '/logs/wordpress-errors.log' );
The above settings do not affect what is displayed on the frontend. This can be set independently using the next setting we're going to discuss below.
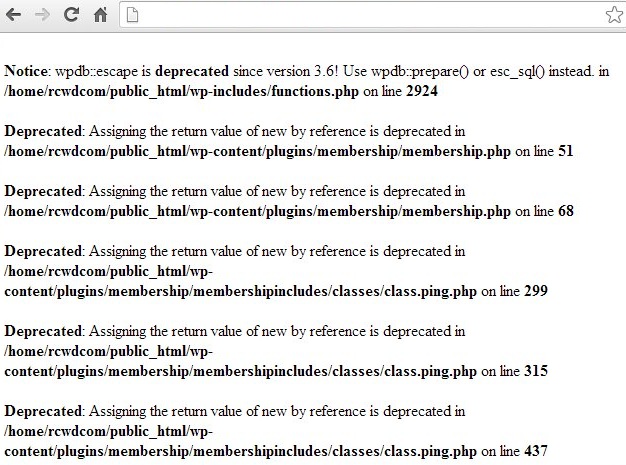
3. Enable/Disable Display Errors with WP_DEBUG_DISPLAY
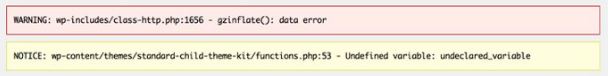
Have a look at the below screenshot. This is what your website could look like if WP_DEBUG_DISPLAY is on. Essentially, this is a setting that forces WordPress to show the errors on the frontend, rather than just writing them to the log file as we have seen in the previous steps.
In most cases, if you have enabled WP_DEBUG_LOG to track any errors caused by your themes and plugins to a log file.
However, if you are working in a development environment, you could also choose to show the PHP notices or errors on the front-end of the site too.
The constant WP_DEBUG_DISPLAY in the wp-config.php file allows you to enable/disable whether debug messages are shown on the frontend of your site.
By default, if you have enabled WordPress debugging, displaying WordPress error messages is set to ‘true’. You can turn it to ‘false’ if you want to hide them.
All you need to do is to add the below line of code to your wp-config.php file.
define( 'WP_DEBUG_DISPLAY', false);
Be cautious if you enable this on a live site, because this can disclose sensitive information. If you enable it temporarily, don't forget to disable once you have identified and fixed your problem.
4. Enable script debugging with SCRIPT_DEBUG
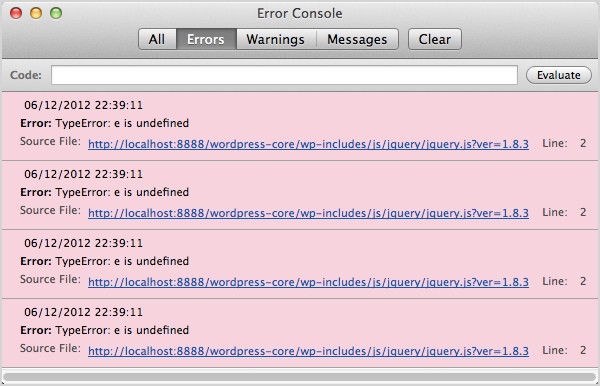
So far we’ve discussed the importance of WP_DEBUG mode and how to enable it on your website installation. There is another important PHP constant that you can enable for WordPress script debugging: SCRIPT_DEBUG.
While enabling WP_DEBUG reveals any errors caused by PHP functions on your WordPress theme and plugins, enabling SCRIPT_DEBUG shows you if there are any Javascript development or CSS errors.
In fact, while debugging if the SCRIPT_DEBUG constant is turned on, it forces WordPress to use the development version of files instead of the minified version.
As you may know, WordPress loads minified versions of CSS and JS files in the live environment. These minified versions of files remove all unnecessary characters in those files in an effort to reduce the file size for faster page loading.
Recommend reading: 21 actions to make WordPress faster
While loading minified files can be extremely helpful in terms of user experience and WordPress SEO, it can be a pain for development purposes especially when you’re trying to find and fixing bugs.
By forcing the installation to load the development version, you can easily figure out what scripts are causing conflicts in your core CSS and JS files. Using this setting in conjunction with the browser tools console allows you to identify where Javascript errors are being thrown so you can fix them.
To turn on SCRIPT_DEBUG, add the following code to your wp-config.php file.
define( 'SCRIPT_DEBUG', true );
5. Enable/ Disable Logging of Database Queries
Once again, while debugging issues, you might want to take note of which database queries are running. In particular, if you are troubleshooting and performance issues, you might want to check exactly which queries are running.
The wp-config.php file has another setting that allows you to log all queries that are run. Add the following line to w-config to enable the saving of queries.
define(‘SAVEQUERIES’, true);
Once you enable this option all queries will be saved in the $wpdb->queries global. If you're not sure what the value of the variable is, you can add the following PHP code snippet script to a file in WordPress. This will output the value of $wpdb->queries global variable.
<?php
    global $wpdb;
    print_r( $wpdb->queries );
?>
Debugging Plugins
Besides log error messages, you might also need to check queries for performance, or otherwise try to understand what's going on underneath the hood. There are a number of other plugins and tools that we recommend you use when you need to perform such debugging or troubleshooting.
1. Query Monitor
Query Monitor is a neat plugin that allows you to see exactly what different plugins on your WordPress installation are doing. Even though the name says that it is a "query monitor" this plugin does more than just monitor database queries.
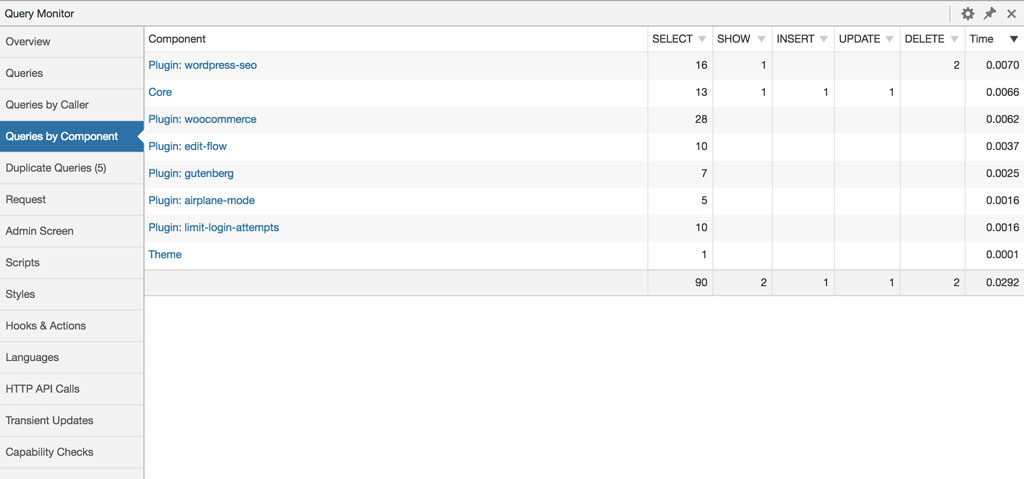
In fact, this plugin can:
- debug queries
- monitor PHP errors
- check hooks and actions
- HTTP API calls
- monitor enqueued scripts and stylesheets
- debugging of AJAX calls
- etc.
You can also narrow such monitoring by plugin, or theme, which helps you to narrow down the sources of problems.
2. Debug Bar
This plugin is typically used by developers as they are coding their themes or plugins. The plugin adds a debug menu to the WordPress admin bar that shows query, cache, and other WordPress debugging information.
The great thing is that it respects the WordPress debug settings we described above.
3. Log Deprecated Notices
This is another developer-oriented plugin. Essentially, logs whether you're using any deprecated functions, files or arguments, such that you can upgrade and fix your code to use the latest recommendations.
Writing to the WordPress Debug Log
As a developer, you should probably add error information to the WordPress debug log as necessary. To do this, you need to use a specific WordPress function that outputs messages to the log:
error_log``( ``"This is a log entry"` `);
If debugging is enabled, the above message would appear in the log file. You can use the above to log exceptions or other unexpected problems.
Frequently Asked Questions
What does WordPress debug do?
The various WordPress debug settings enable the viewing of any notices, such as errors, deprecated functions or any other error logs generated by themes, plugins and other WordPress functions. By enabling the settings above, you can identify and fix any errors in your WordPress plugins or themes.
Where is the WordPress debugging log?
The WordPress debugging log is usually found in the root directory with the name debug.log. Using the settings above, you can change the location of the WordPress debugging log to a location that is more convenient for you.
How do I disable debugging in WordPress?
To disable debugging in WordPress, simply add the following entry to your wp-config.php file: define( 'WP_DEBUG', false ); You might also want to check the rest of the settings that we describe in this article.
What does WP Debug do?
The WP Debug setting in the wp-config.php file is used to enable or disable WordPress debugging.
Does WordPress debugging affect performance?
Yes, WordPress debugging has a performance impact because it adds some overhead, including the need to output to a file. It is recommended that when you have completed debugging, you disable all such settings. This also makes your installation more secure, since sensitive information might be included in debug logs.
Summary
If you want a quick summary of all that we've discussed, have a look at the below wp-config.php example file with all the settings in place:
// Enable WP_DEBUG mode - to disable just put false instead of true
define( 'WP_DEBUG', true );

// Enable Debug logging to the /wp-content/debug.log file
define( 'WP_DEBUG_LOG', true );
// Comment the above file and uncomment the below to log to a specific file
//define( 'WP_DEBUG_LOG', '/logs/wordpress-errors.log' );

// Disable display of errors and warnings / switch to true to enable
define( 'WP_DEBUG_DISPLAY', false );

// Use dev versions of core JS and CSS files (only needed if you are modifying these core files)
define( 'SCRIPT_DEBUG', true );

// Log queries enabled, switch to false to disable
define(‘SAVEQUERIES’, true);
White Screen of Death + WP Permission Settings
https://kinsta.com/blog/wordpress-white-screen-of-death/
White Screen of Death?
True to its name, the WordPress White Screen of Death (also known as “WSoD”) occurs when, instead of the web page you’re trying to access, you’re faced with a blank white screen in its place.
Depending on the browser you’re using, you could get different error messages. Below is an example in Google Chrome, which includes an HTTP 500 error warning “This page isn’t working and is unable to handle the request”:
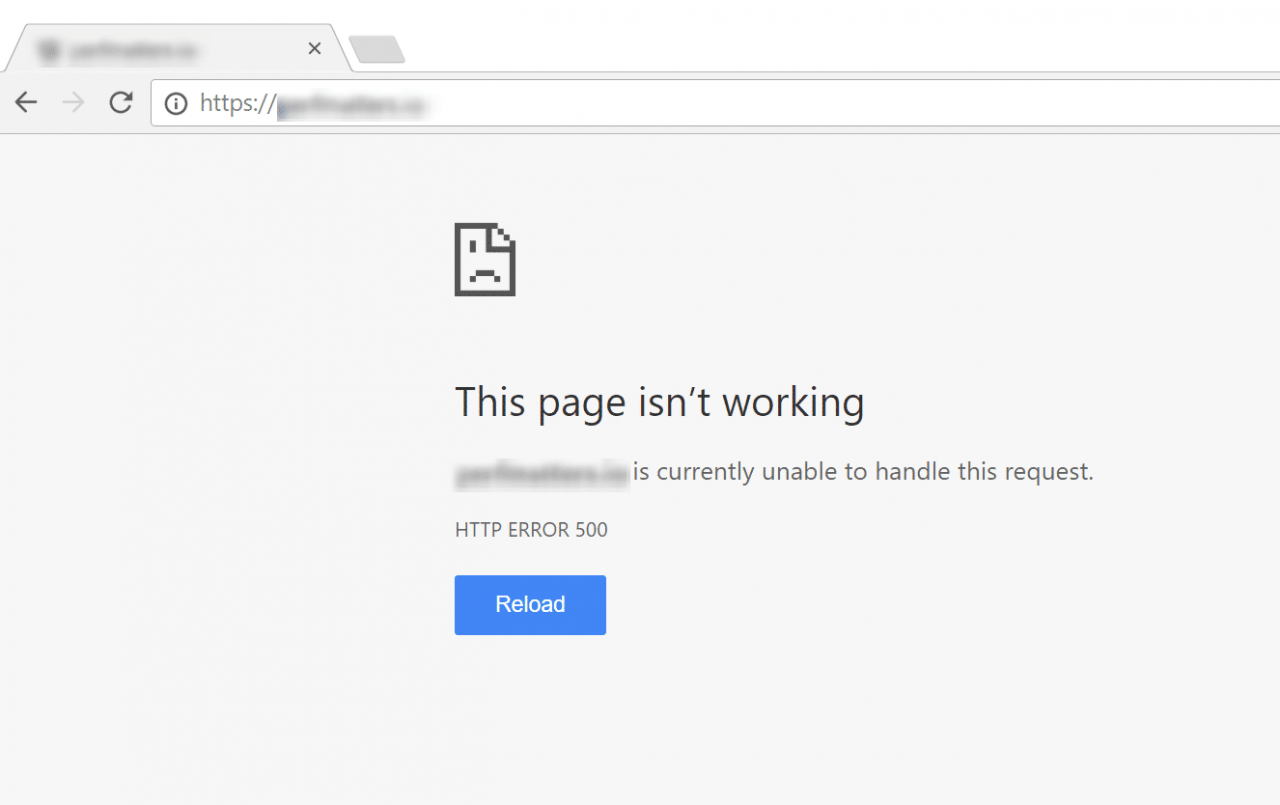
The WordPress White Screen of Death in Google Chrome
Now let’s take a look at the White Screen of Death in Mozilla Firefox:
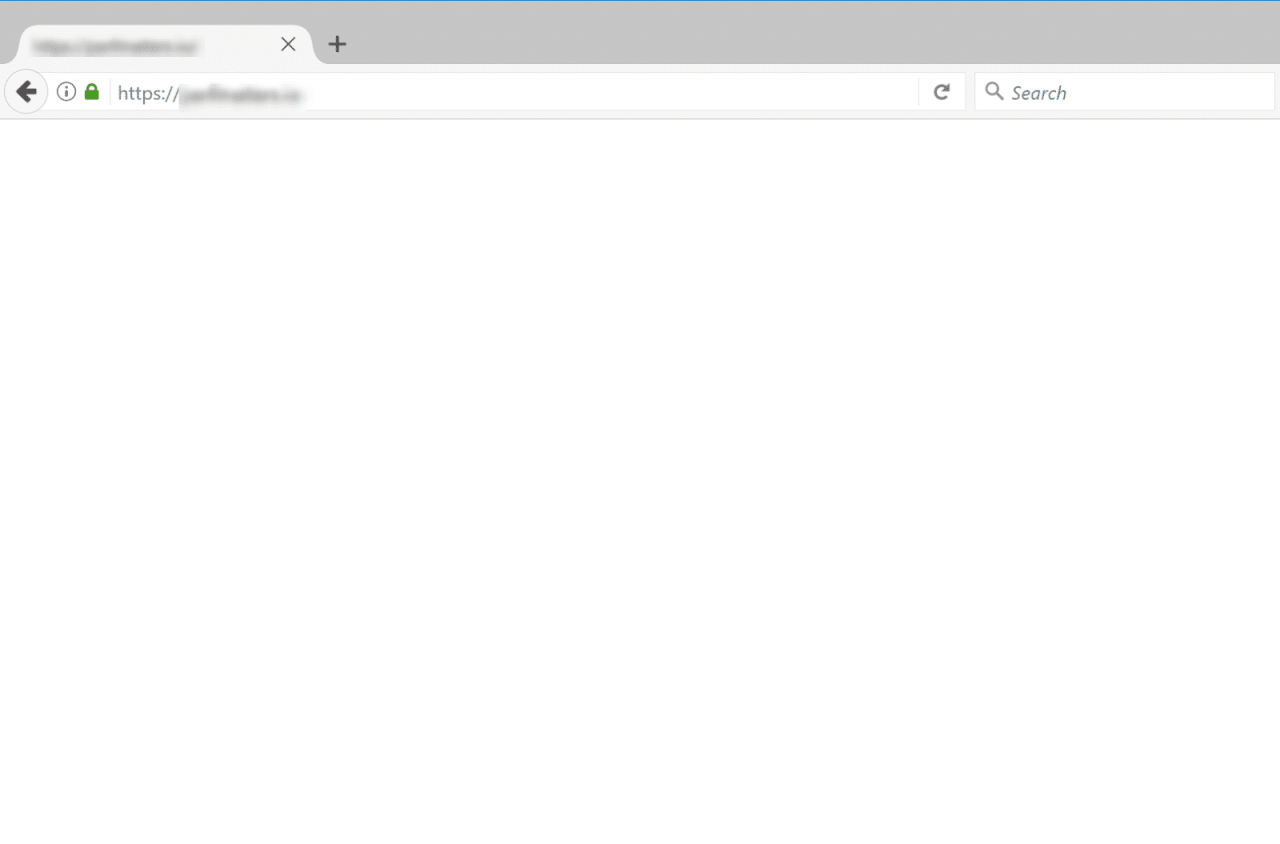
The WordPress WSoD in Mozilla Firefox
As you can see, it’s just a plain white screen. It doesn’t contain any useful errors or warning messages.
The WordPress White Screen of Death is almost always caused by PHP code errors or memory limit exhaustion.
Another possible cause is a faulty theme or plugin. The latter is likely the issue if the frontend of the website is down, but your WordPress admin area is up. To quickly check whether the dashboard on your site is working, simply navigate to yourdomain.com/wp-admin.
So, how do you fix WSoD? Glad you asked!
How to Fix WordPress White Screen of Death (9 Methods)
When you experience the WordPress White Screen of Death, your priority will be to fix it as quickly as possible. With that in mind, let’s take a look at nine possible solutions you can use to resolve it.
- Disable Your WordPress Plugins
- Switch to a Default WordPress Theme
- Clear Browser and WordPress Plugin Cache
- Switch on Debugging Mode
- Increase Your Memory Limit
- Check File Permission Issues
- Check for Failed Auto-Update Issues
- Resolve Syntax Errors or Restore a Backup
- Increase the PHP Text Processing Capability
1. Disable Your WordPress Plugins
One of the easiest and most common ways to fix the WordPress WSoD is to simply disable all of your plugins. Often, a site goes down due to a bad plugin update.
If you can still access your admin area, a quick way to do this is to navigate to Plugins from the dashboard, select all plugins, and then click on Deactivate from the Bulk Actions dropdown menu:
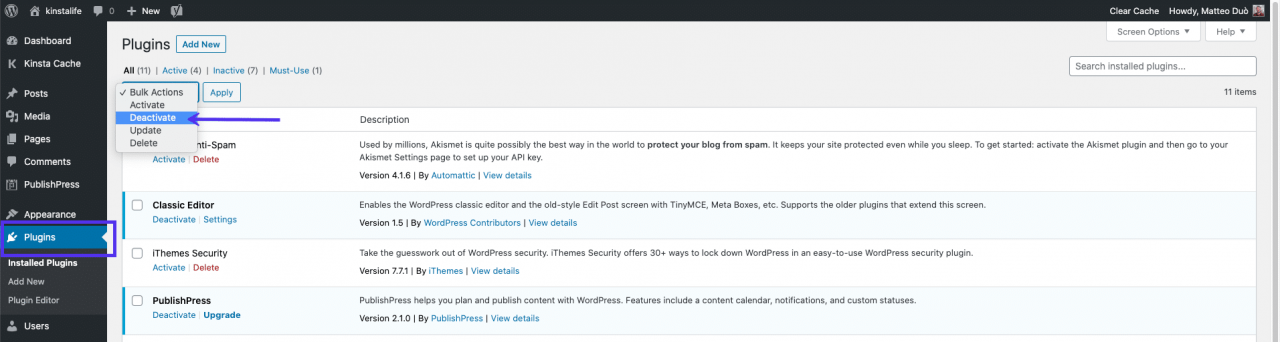
The Deactivate all WordPress Plugins setting
This will disable all of your plugins.
If that fixes the issue, you’ll need to find the culprit. To do this, you can start activating the plugins one by one, reloading the site after each activation. When your frontend goes down, you’ve found the misbehaving plugin.
You can then reach out to the plugin’s developer for help or post a support ticket in the WordPress Plugin Directory.
If you can’t access your dashboard, you can use a File Transfer Protocol (FTP) client to access your site’s files directory.
Under the wp-content folder of your root directory, locate the plugins folder. Rename it to something along the lines of “plugins_old”:
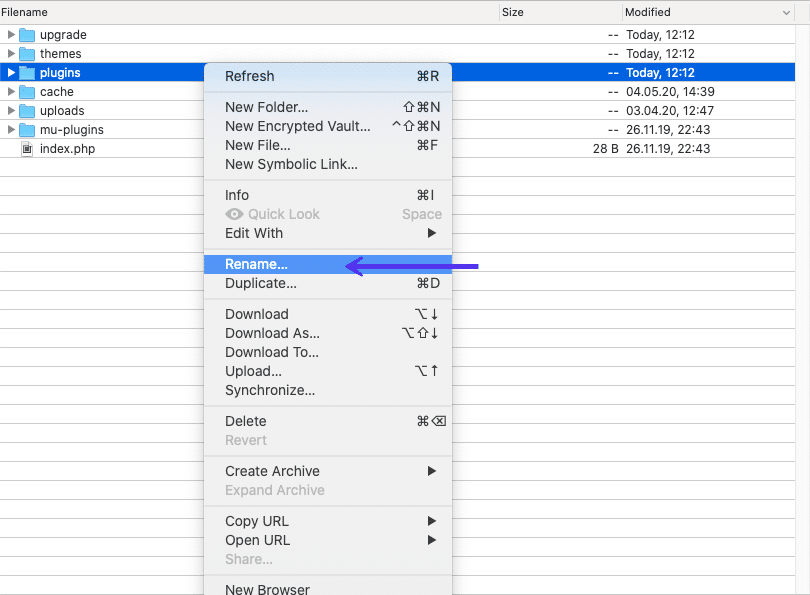
Rename your plugins folder
Then, check your site again on the frontend. If this works, you will need to test each plugin one by one. Rename your plugin folder back to “plugins”, and then individually rename each plugin folder inside of it until you locate the faulty one.
2. Switch to a Default WordPress Theme
If the problem isn’t a plugin, your WordPress theme may be the cause of the White Screen of Death. To see if this is the issue, you can replace your theme by switching to a default one.
If you can access your admin area, go to Appearance > Themes in your dashboard. Locate and activate a default WordPress theme such as Twenty Twenty:
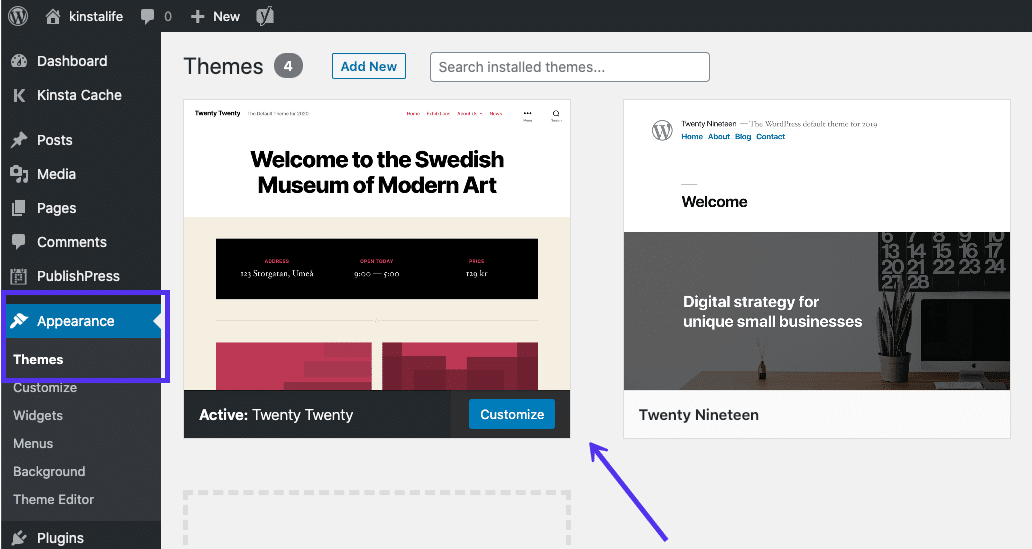
The Twenty Twenty WordPress theme.
Then, test your site again. If it works, you’ll know the problem lies with your theme.
If you can’t access your dashboard, the process is the same as it is with plugins.
Use FTP to access your site’s files, and rename your wp-content/themes folder to something else:
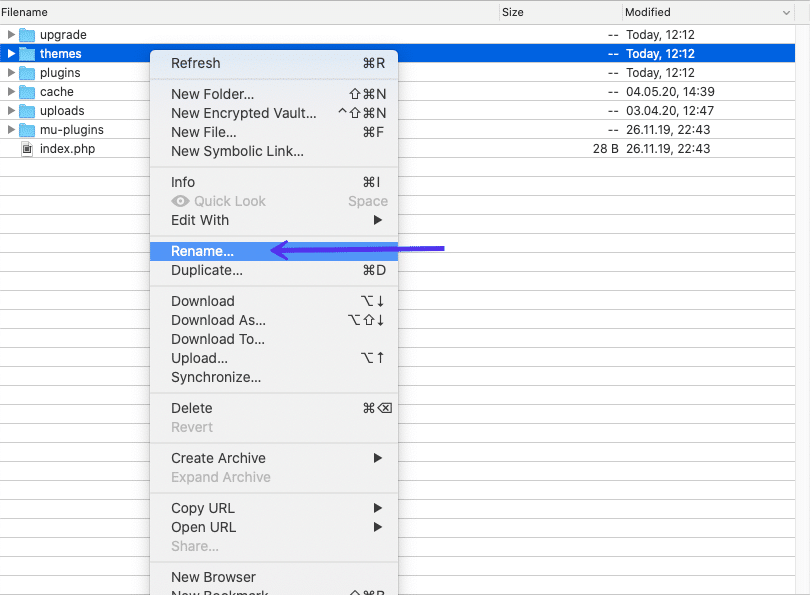
Rename your themes folder
WordPress will then revert to the latest default theme, which is most likely Twenty Twenty. If you don’t have any other themes, you can download one from the WordPress Theme Directory and then upload it to your themes folder.
After that, go ahead and check your site again. If it works, perhaps your theme has had a conflict or a bad update. If this is the case, you might need to reach out to the developer for help or consider switching themes.
3. Clear Browser and WordPress Plugin Cache
If you have access to the backend of your WordPress site but are still seeing the WSoD on the frontend, it might be due to an issue with your cache.
To fix it, try clearing your web browser’s cache and your WordPress caching plugin (assuming you have one installed).
If you have a caching plugin installed on your WordPress site, such as WP Rocket or WP Super Cache, most offer a quick way to clear the cache via the plugin’s settings page.
Using WP Super Cache as an example, in your WordPress dashboard you would navigate to Settings > WP Super Cache > Delete Cache:
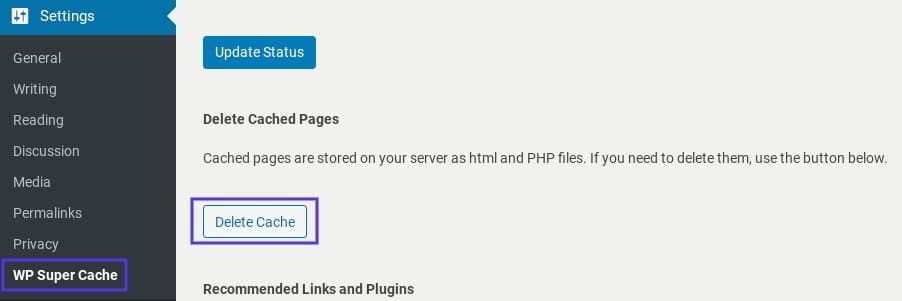
The WP Super Cache plugin settings page
How to Clear Your Cache from MyKinsta
If you’re a Kinsta user, there’s also an easy way for you to clear your cache using MyKinsta. To do this, log in to your account. Click on Tools, followed by Clear cache under the Site Cache section:
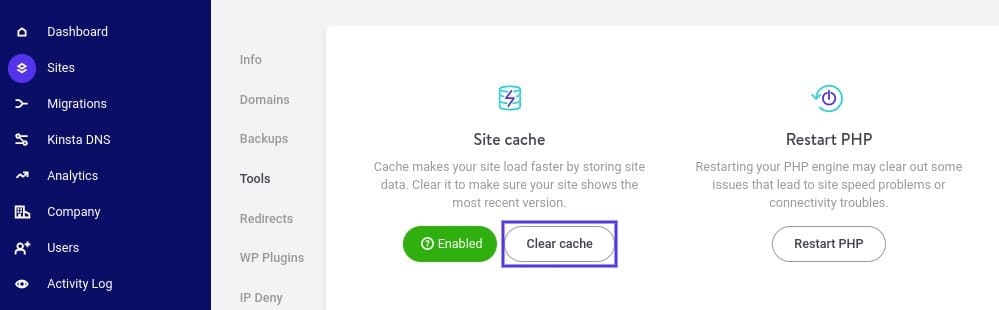
The Clear cache option in MyKinsta
Once you empty the cache, save your changes. Then revisit your site to see whether that corrected the issue. If not, it’s time to move on to another solution.
4. Switch on Debugging Mode
If you are still seeing the WordPress White Screen of Death, the admin area isn’t working, or you think you’ve found the problem but want to dig deeper, you can enable debugging mode. This will show any errors that are occurring on your website.
To enable debugging, you’ll need to open the wp-config.php file of your WordPress install. Within it you should find the following line:
define( 'WP_DEBUG', false );
Change “false” to “true”, and then reload your site. If this line doesn’t exist, you can add it to the top of the file.
Instead of the white screen, you’ll get a white screen and some error messages. This isn’t a huge improvement, but it’s only a start. The WSoD error message should state which file the problem originated in, like this:
Cannot redeclare get_posts() (previously declared in
/var/www/html/wordpress/wp-includes/post.php:1874) in
/var/www/html/wordpress/wp-content/plugins/my-test-plugin/my-test-plugin.php on line 38
You can see at the end of this example message that the problem is in line 38 of a plugin called my-test-plugin. Therefore, disabling that plugin should resolve the issue.
If you don’t see any errors at all after enabling debug mode, you might need to reach out to your web host. It’s possible debugging isn’t correctly configured on your server.
Kinsta customers have the option to use a built-in debugging tool. From the MyKinsta dashboard, click on your website’s name followed by Tools. Under WordPress debugging, select Enable:
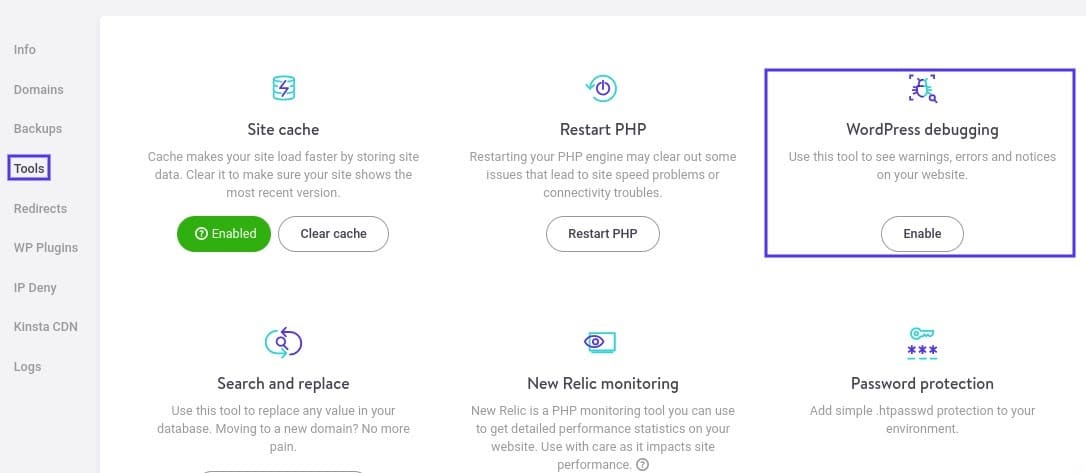
How to enable WordPress debugging mode in MyKinsta
You can then access your error log under the Logs section of your MyKinsta dashboard, and explore them to learn more about the problem.
Keep in mind that having the debugging mode turned on can expose some of your website’s information to unapproved users. Therefore, make sure to always turn the mode off when you’re done using it.
Info
Would love to give MyKinsta a test run? Create your demo account for free and start playing around with it.
5. Increase Your Memory Limit
If you still see the dreaded WSoD empty page after trying some of the above solutions, or you get an error complaining about memory limits or exhausted memory, you’ll need to assign more memory to the application.
This can be done through the wp-config.php file on many WordPress installs. Open the file and add the following code:
define('WP_MEMORY_LIMIT', '64M');
If this doesn’t seem to work, you have a few options. In a regular environment, you can use your .htaccess file to increase the memory limit. Simply add the following line:
php_value memory_limit 64M
If you can’t access your .htaccess file, you can use your php.ini file to increase the memory limit instead.
Struggling with downtime and WordPress issues? Kinsta is the hosting solution designed with performance and security in mind! Check out our plans
To do that, connect to your server via FTP. In the root directory of your site, look for the php.ini file. Once you locate it, add the following line anywhere inside the file:
memory_limit = 64M
If you’re still out of memory and need to assign more, there may be an issue within your application. Perhaps your theme or one of your plugins is using an inordinate amount of resources.
At this point, you may want to hire a developer to take a look. Even your host may be able to help, by showing you the SQL logs and other resource stats for your site.
Kinsta customers won’t need to increase their memory limit as all of our plans set a default memory limit of 256 MB.
6. Check File Permission Issues
Another potential cause of the WSoD is permission and ownership issues. It is possible to fix this problem yourself. However, unless you really know what you’re doing, we would advise against it as you can inadvertently create vulnerabilities that attackers can exploit.
When it comes to WordPress permissions, there are three simple rules to follow:
- Files should be set to 664 or 644.
- Folders should be set to 775 or 755.
- The wp-config.php file should be set to 660, 600, or 644.
If you have SSH access to your server, you can apply the appropriate rules with the following command, running it from the root WordPress directory:
sudo find . -type f -exec chmod 664 {} +
sudo find . -type d -exec chmod 775 {} +
sudo chmod 660 wp-config.php
If you are unsure how to do this or are a bit intimidated, go ahead and ask your web host for help.
7. Check for Failed Auto-Update Issues
Sometimes WordPress runs into an issue with updates, such as when the server times out. More often than not, this problem resolves itself automatically. However, in some rare cases, it may lead to the WordPress White Screen of Death.
The first thing you should do is go into your WordPress root directory and see if there’s a .maintenance file there (the file’s name may be abbreviated as well).
What you’d want to do is try deleting that file and loading up your site again.
If the update was successful, but WordPress failed to remove this file automatically, everything should go back to normal.
If the update was not completed, it may be restarted automatically, in which case things should go back to normal just the same.
If all else fails, follow the recommended manual update procedure for WordPress, which should resolve the issue once and for all.
8. Resolve Syntax Errors or Restore a Backup
Another common cause for the WordPress WSoD is when you’re editing the code on your WordPress site and accidentally mistype something or use the wrong syntax.
One character in the wrong place could take down your entire site, which is why you should never edit code on your live production site.
Not to worry, though. You can always connect to your site via FTP and revert the change you made manually. If you don’t know what change caused the problem, this is where having WordPress backups in place comes in handy.
Here at Kinsta, you can restore your site to an earlier point in time with a single click. To do this, log in to your MyKinsta dashboard and navigate to Backups:
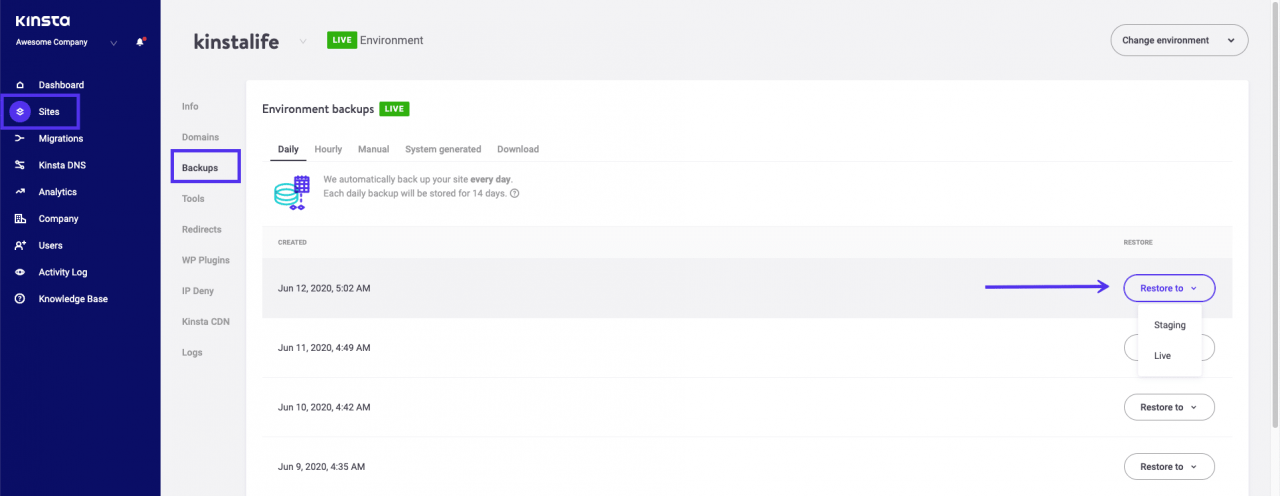
The backup feature in MyKinsta
Keep in mind that if you enabled debug mode in WordPress earlier, there might also be an error message indicating a parse syntax error. If this is the case, it should tell you exactly where to find the problem code.
9. Increase the PHP Text Processing Capability
At this point, if the WSoD has not yet been resolved, there’s one additional trick you can try. On rare occasions, this problem might occur because of a page or post is particularly long.
If this is the case, you can try adjusting the PHP text processing capability on your site, by increasing the backtrack and recursion limits. To do so, paste the following code within your wp-config.php file:
/* Trick for long posts /
ini_set('pcre.recursion_limit',20000000);
ini_set('pcre.backtrack_limit',10000000);
Once you add this code, save your changes. Then refresh your site to see if it’s now working.
Summary
The WordPress White Screen of Death can be incredibly frustrating, even frightening. There are a number of things that can go wrong, but thankfully the situation is usually not as bad as it seems.
A simple plugin and/or theme check should fix the WSoD issue in most cases. Getting more familiar with WordPress debug mode will definitely shed more light on the problem and guide you.