
EWWWW.io
KeyCDN


[code language=”bash”]
<IfModule mod_expires.c>
ExpiresActive On
# Images
ExpiresByType image/jpeg "access plus 1 year"
ExpiresByType image/gif "access plus 1 year"
ExpiresByType image/png "access plus 1 year"
ExpiresByType image/webp "access plus 1 year"
ExpiresByType image/svg+xml "access plus 1 year"
ExpiresByType image/x-icon "access plus 1 year"
# Video
ExpiresByType video/webm "access plus 1 year"
ExpiresByType video/mp4 "access plus 1 year"
ExpiresByType video/mpeg "access plus 1 year"
# Fonts
ExpiresByType font/ttf "access plus 1 year"
ExpiresByType font/otf "access plus 1 year"
ExpiresByType font/woff "access plus 1 year"
ExpiresByType font/woff2 "access plus 1 year"
ExpiresByType application/font-woff "access plus 1 year"
# CSS, JavaScript
ExpiresByType text/css "access plus 1 month"
ExpiresByType text/javascript "access plus 1 month"
ExpiresByType application/javascript "access plus 1 month"
# Others
ExpiresByType application/pdf "access plus 1 month"
ExpiresByType image/vnd.microsoft.icon "access plus 1 year"
</IfModule>
[/code]
PageSpeed: Leverage browser caching
Overview
Page load times can be significantly improved by asking visitors to save and reuse the files included in your website.
- Reduces page load times for repeat visitors
- Particularly effective on websites where users regularly re-visit the same areas of the website
- Benefit-cost ratio: high
- Access needed
General guidelines for setting expiries:
- Truly static content (global CSS styles, logos, etc.) – access plus 1 year
- Everything else – access plus 1 week
How does your site score on this recommendation?
Analyze
What is browser caching?
Every time a browser loads a webpage it has to download all the web files to properly display the page. This includes all the HTML, CSS, JavaScript and images.
Some pages might only consist of a few files and be small in size – maybe a couple of kilobytes. For others however there may be a lot of files, and these may add up to be several megabytes large. Twitter.com for example is 3 MB+.
The issue is two fold.
- These large files take longer to load and can be especially painful if you're on a slow internet connection (or a mobile device).
- Each file makes a separate request to the server. The more requests your server gets simultaneously the more work it needs to do, only further reducing your page speed.
Browser caching can help by storing some of these files locally in the user's browser. Their first visit to your site will take the same time to load, however when that user revisits your website, refreshes the page, or even moves to a different page of your site, they already have some of the files they need locally.
This means the amount of data the user's browser has to download is less, and fewer requests need to be made to your server. The result? Decreased page load times.
How does it work?
Browser caching works by marking certain pages, or parts of pages, as being needed to be updated at different intervals. Your logo on your website, for instance, is unlikely to change from day to day. By caching this logo image, we can tell the user's browser to only download this image once a week. Every visit that user makes within a week would not require another download of the logo image.
By the web server telling the browser to store these files and not download them when you come back saves your users time and your web server bandwidth.
Why is it important?
The main reason why browser caching is important is because it reduces the load on your web server, which ultimately reduces the load time for your users.
How to leverage browser caching
Read our Lighthouse documentation to learn more about enabling browser caching.Lighthouse: Cumulative Layout Shift
Overview
Cumulative Layout Shift (CLS) is a performance metric introduced in 2020 by Lighthouse to measure the perceived visual stability of a page load.
Simply put, CLS measures the unexpected shifting of web elements while the page is being rendered. This measurement is then quantified as an aggregate score of all the individual layout shifts on your page.
CLS is also one of the metrics that make up Google's Web Vitals. Learn more about Google's Web Vitals initiative here.
Lighthouse: Largest Contentful Paint
Overview
Largest Contentful Paint (LCP) is a performance metric introduced in 2020 by Lighthouse to better measure the perceived loading experience for users.
In the simplest terms, LCP measures how long it takes for the largest "content element" (e.g., hero image, heading text, etc.) on your page to become visible within your visitor's viewport.
LCP is one of the metrics that make up Google's Web Vitals. Learn more about Web Vitals here.
What does Largest Contentful Paint measure?
According to Google,"LCP is an important user-centric metric for measuring perceived load speed because it marks the point in the page load timeline when the page's main content has likely loaded – a fast LCP helps reassure the user that the page is useful."
Basically, LCP measures how fast substantial content on your web page can be consumed by your visitors. The assumption is that loading the largest content element on your page, like a carousel or hero image, would be a major indicator to your visitors of how fast your page loaded.

LCP measures how fast the largest content element loads on your page.
A "content element" is any HTML element, such as:
- An image element
- A video element
- An element with the background image loaded via the URL function (instead of declaring it in the CSS)
- Block-level elements such as h2, h2, div, ul, table, etc.
Read this article to understand the entire list of elements considered for LCP.
GTmetrix measures how quickly the largest above-the-fold content element is painted onto your page.
Websites with similar structures may score very differently on the LCP metric as the largest content element will differ from page to page.
LCP is an easy metric to understand as all you need to do is look at your webpage, identify the largest text block or image, and then optimize its load time.
Largest Contentful Paint's effect on your Performance Score
As a Web Vital metric, LCP accounts for 25% of the Performance Score, making it one of the most important metrics to optimize.
While other metrics such as First Contentful Paint (FCP) or Time-to-First-Byte (TTFB) continue to remain relevant within the context of page speed, LCP is more representative of your visitors' real-world expectations when accessing your website.

A faster LCP gives the impression that your page loaded faster.
The green website looks more visually complete at 0.2s than the red website.
What that means for you is, optimizing your LCP can often make the biggest improvement in web performance for your site, both, in terms of Performance Score and your visitors' perception of performance.
Thresholds for Largest Contentful Paint
Thresholds for LCP are measured by the render time (in seconds) of the largest image or text block visible within the visitor's viewport.
LCP thresholds are, as follows:
- Good – nothing to do here = LCP of 1200 milliseconds or less.
- OK, but consider improvement = LCP between 1200 and 1666 milliseconds.
- Longer than recommended = LCP between 1666 and 2400 milliseconds.
- Much longer than recommended = LCP higher than 2400 milliseconds.
Largest Contentful Paint Element in Structure Tab
You can see what GTmetrix detected as the largest content element on your page in the Structure tab of the report. It is listed under the "Largest Contentful Paint Element" audit.
Note that this audit is purely informative and does not contribute to your Performance or Structure Score.
How to improve Largest Contentful Paint?
*Note* that the particular audits mentioned below likely contribute the most to your LCP; however, your page's LCP timing may also be affected by other optimizations that aren't mentioned here.
Improve your LCP timing by incorporating good web development practices, such as:
1) Reducing server response time
Reducing server response time helps load resources faster and deliver a fast LCP time on your page. Some of the things you can do here include:
- a) Reducing initial server response time
- b) Using a Content Delivery Network (CDN)
- c) Serving static assets with an efficient cache policy
- d) Establishing early connections to important third-party origins
2) Eliminating render-blocking behaviour
Eliminating render-blocking behaviour on your page ensures resources load as fast as possible.
Read our blog article to learn more about this optimization.
3) Optimizing images and videos
Optimize image and video delivery on your page to reduce the time taken to load images and videos. Some of the things you can do include:
- a) Properly sizing images
- b) Efficiently encoding images
- c) Combining images using CSS sprites
- d) Serving images in next-gen formats
- e) Using video formats for animated content
Lighthouse: First Contentful Paint
Overview
First Contentful Paint (FCP) is a performance metric that measures how quickly visitors can view actual content (i.e., text, images, video, etc.) on your page.
FCP, which is tied to your page's load speed, is one of the metrics we were already tracking in our Legacy Reports. Read more about it here.
Your page's FCP is the total time taken from the beginning of your page load to the point any content is rendered on the screen.
A low FCP time contributes to a positive user experience, as your visitors perceive the page to be loading fast if content is delivered sooner.
What does First Contentful Paint measure?
According to Google:
"First Contentful Paint measures how long it takes the browser to render the first piece of DOM content after a user navigates to your page. Images, non-white <canvas> elements, and SVGs on your page are considered DOM content; anything inside an iframe isn't included."

The faster your page renders consumable content (like text), the better the perceived performance your visitor experiences.
FCP is an important, user-centric metric for measuring perceived performance because it marks the point where visitors can first see any consumable content on the screen.
A fast FCP reassures the user that something is happening during your page load; a slow FCP implies that it's not doing anything, and thus is slow.
By contrast, the First Paint Timing measures the point at which anything is rendered on the screen (e.g., a background color, a border, etc.) – which is far less useful.
First Contentful Paint's effect on your Performance Score
This metric accounts for 15% of the total Performance Score, signifying its relatively high importance.
Optimizing your page to improve FCP usually provides sizeable gains, both, in actual page load times and user perception of your site's performance.
Thresholds for First Contentful Paint
FCP thresholds are, as follows:
- Good – nothing to do here = FCP time of 934 milliseconds or less.
- OK, but consider improvement = FCP time between 934 and 1205 milliseconds.
- Longer than recommended = FCP time between 1205 and 1600 milliseconds.
- Much longer than recommended = FCP time higher than 1600 milliseconds.
How to improve First Contentful Paint?
*Note* that the particular audits mentioned below likely contribute the most to your FCP; however, your page's FCP may also be affected by other optimizations that aren't mentioned here.
Improve your FCP by incorporating good development practices into your workflow, such as:
1) Reducing server response time
Reducing server response time helps deliver a fast FCP time on your page. Some of the things you can do here include:
- a) Reducing initial server response time
- b) Using a Content Delivery Network (CDN)
- c) Serving static assets with an efficient cache policy
- d) Avoiding multiple page redirects
- e) Establishing early connections to important third-party origins
2) Eliminating render-blocking resources
Eliminating render-blocking behaviour on your page ensures resources load as fast as possible.
Read our blog article to learn more about this optimization.
3) Minimizing request counts and payload sizes
Try and keep your request counts and payload sizes as small as possible, so that resources can load fast and the browser can start rendering content on your page sooner.
Note: Some of the Structure audits are related; improving one is likely to improve the others.
Summary
Official Lighthouse Documentation
Lighthouse: Speed Index
Overview
Speed Index (SI) is a performance metric that measures how quickly your page is visually complete above-the-fold.
SI is dependent on the size of the browser view port and differs from other metrics like First Contentful Paint (FCP) or Largest Contentful Paint (LCP) because it is not a milestone on your page's loading timeline.
Instead, it is the result of a calculation that reflects your visitor's page experience utilizing a frame-by-frame analysis of your page's load behaviour.
SI is very much tied to other page load timings. This makes it a useful overall benchmark for assessing your website's performance in its entirety.
What does Speed Index measure?
The Speed Index metric is a synthetic timing that is calculated, not measured. It is computed using visual differences between frames captured during your page load.
Each visual frame represents time intervals, and each captured frame is scored for visual completeness above-the-fold until all content is visible i.e., when the page is visually complete.

The Speed Index metric measures how visually complete your page is by analyzing its load, frame-by-frame.
The individual scores are then added to compute the page's Speed Index. Click here to learn more about how SI is calculated.
Because other metrics like LCP and FCP affect your page's visual completeness, SI is a great way to track their impact in the grand scheme of things.
Think of Speed Index as a unified metric that accounts for many of the other metrics and audits.
SI, on its own, does not give you much actionable information. However, it represents a practical way to determine if your page speed optimizations are working.
Speed Index' effect on your Performance Score
Speed Index accounts for 15% of the Performance Score, signifying its relatively high importance.
Effectively, a lower SI indicates that above-the-fold content loaded much earlier, giving your visitors the perception of a faster loading page.
Thresholds for Speed Index
GTmetrix displays the calculated Speed Index in seconds, with a lower time representing a faster loading webpage.
SI thresholds are, as follows:
- Good – nothing to do here = SI of 1311 milliseconds or less.
- OK, but consider improvement = SI between 1311 and 1711 milliseconds.
- Longer than recommended = SI between 1711 and 2300 milliseconds.
- Much longer than recommended = SI higher than 2300 milliseconds.
How to improve Speed Index?
*Note* that the particular audits mentioned below likely contribute the most to your SI; however, your page's Speed Index may also be affected by other optimizations that aren't mentioned here.
In general, most performance optimizations that result in a faster First Contentful Paint and Largest Contentful Paint are also likely to result in a faster Speed Index for your page.
Freeing the main-thread for longer, in particular, ensures that the browser can load all visible content faster for your page visitors (i.e., faster visual completeness). Some of the optimizations here include:
- 1) Reducing JavaScript execution time
- 2) Minimizing main-thread work
- 3) Removing unused JavaScript
- 4) Reducing the impact of third-party code
- 5) Replacing large JavaScript libraries with smaller alternatives
Note: Some of the Structure audits are related; improving one is likely to improve the others.
Lighthouse: Time to Interactive
Overview
Time to Interactive (TTI) is a performance metric that measures a page's load responsiveness and helps identify situations where a page looks interactive but actually isn't.
TTI measures how long it takes a page to become fully interactive i.e. it measures the time between First Contentful Paint (FCP) and the last long-task on the main-thread (before a 5 second quiet window) and represents the point at which the browser is capable of reliably responding to user input.
In simple terms, a fast TTI helps ensure that the page is usable.
-
MetricsCumulative Layout ShiftFirst Contentful PaintLargest Contentful PaintSpeed IndexTime to InteractiveTotal Blocking TimeWeb VitalsAudits
What does Time to Interactive measure?
According to Google,"A page is considered fully interactive when it displays useful content, as measured by First Contentful paint; event handlers are registered for most visible page elements, and; the page responds to user interactions within 50 milliseconds."
TTI is an important user-centric metric because it measures how quickly visitors are able to fully interact with your page.
To visitors, a slow TTI can feel like your website is unresponsive, broken or doesn't work.
For example, we've all experienced situations where elements of a website quickly become visible; yet when we try to click/tap on them, nothing happens.
These scenarios are mostly caused by third-party scripts that block the main- thread thus increasing your TTI.
As a result, your visitors may get frustrated and decide to leave your webpage.
Reducing TTI is crucial to your web performance, particularly, on mobile devices where this effect is more pronounced.
Time to Interactive's effect on your Performance Score
The TTI metric accounts for 15% of the total Performance Score, signifying its relatively high importance.
Optimizing this metric can help your visitors perceive a noticeable improvement in how fast they can fully interact with and use your page.
Note that TTI is a companion metric to Total Blocking Time (TBT) and, together, they provide deeper insights into your page's responsiveness to user input.
How is TTI measured?
TTI is measured in Lighthouse by taking the point in time at the end of the last long task.
The last long task is determined when:
- FCP has already been triggered.
- Both CPU and Network activity are idle for a period of 5 seconds without interruption.
This essentially tells Lighthouse that content has been painted, and the browser is no longer processing scripts or downloading requests (i.e., the page is ready for interaction).
If CPU and Network idle periods are interrupted (by additional processing or downloading of new requests initiated by scripts), TTI gets extended to the end of the next last long task, until the 5 second idle period of both is satisfied.
Thresholds for Time to Interactive
The TTI metric is a synthetic timing that measures how long your page takes to become fully interactive and displays the result in seconds.
Click here to learn more about how TTI is calculated.
TTI thresholds are, as follows:
- Good – nothing to do here = TTI of 2468 milliseconds or less.
- Ok, but consider improvement = TTI between 2468 and 3280 milliseconds.
- Longer than recommended = TTI between 3280 and 4500 milliseconds.
- Much longer than recommended = TTI higher than 4500 milliseconds.
How to improve Time to Interactive?
*Note* that the particular audits mentioned below likely contribute the most to your TTI; however, your page's TTI may also be affected by other optimizations that aren't mentioned here.
Improve your TTI metric by incorporating good web development practices, such as:
1) Optimizing JavaScript execution
Optimize your JavaScript execution to reduce main-thread blocking time, and ensure that your page responds quickly to user inputs. Some of the things you can do include:
- a) Reducing JavaScript execution time
- b) Minimizing main-thread work
- c) Removing unused JavaScript
- d) Reducing the impact of third-party code
- e) Replacing large JavaScript libraries with smaller alternatives
2) Serving minimal requests
Ensure that you keep request counts as low as possible for the intended application. Similarly, avoid chaining critical requests to speed up the loading of key resources.
3) Using resource hints to establish early connections
Use the preconnect and dns-prefetch resource hints to establish early connections to third-party servers and fetch resources sooner.
Similarly, preload key requests to ensure that your visitors can use your page sooner in the page load timeline.
Note: Some of the Structure audits are related; improving one is likely to improve the others.
Lighthouse: Total Blocking Time
Overview
Total Blocking Time (TBT) is a Lighthouse Performance metric introduced in 2020 that quantifies your page's load responsiveness to user input.
In the simplest terms, TBT measures the total amount of time your webpage was blocked, preventing the user from interacting with your page.
It is one of the Web Vitals and is a replacement for the field-only First Input Delay (FID) metric, seen in PageSpeed Insights.
How does your site score on this metric?
Analyze
What does Total Blocking Time measure?
According to Google,"TBT measures the total time between First Contentful Paint (FCP) and Time to Interactive where the main-thread was blocked for long enough to prevent input responsiveness."
Basically, the browser uses what's called the main-thread to parse HTML, construct DOM, execute CSS and JavaScript, process user events, and perform other important tasks.
When any one of these tasks runs longer than 50 ms (also known as a Long Task), the main-thread is considered "blocked" because the browser cannot interrupt a task in progress.
If the main-thread is blocked, your page can't respond to user inputs like screen taps, keyboard presses, or mouse clicks.
The excess time beyond 50 ms is considered the individual blocking time for that request.
The sum of all these blocking times is your page's Total Blocking Time.

Any task longer than 50 ms is considered a Long Task. The above example has 3 Long Tasks (in red).
Source: Google
For example, in the above image, there are 5 tasks on the main-thread, 3 of which are Long Tasks, as their individual durations exceed 50 ms. The blocking times for each Long Task are, as follows:
- Task A – 220 ms
- Task B – 70 ms
- Task E – 145 ms
The TBT, in this scenario, is 435ms. If, however, the main-thread only had one task that took 500 ms, the TBT would be 500 ms.
Total Blocking Time vs Time to Interactive
Time to Interactive (TTI) is another metric that is related to your page interactivity. TBT and TTI complement each other yet provide completely different perspectives on your page experience.
TTI signals when your page is fully interactive; TBT specifically tells you which JavaScript tasks took the longest to execute.
TTI considers a page fully interactive if the main-thread has been free of long tasks for at least 5 seconds.
Consider the following scenarios:
- A) Three 60 ms tasks spread out over a 5 second period.
- B) One 5-second Long Task.
Both of the above scenarios would push back TTI by the same amount.

Scenario A is largely interactive throughout the page load, as no long tasks take up too much of the browser's time.
However, both scenarios would feel very different to a user as the first scenario has a TBT of only 30 ms whereas the second scenario has a TBT of 4950 ms.
Scenario A is largely interactive throughout the page load, as no long tasks take up too much of the browser's time, while Scenario B is not interactable at all while the browser is busy handling the long task.
This makes TBT, both, an insightful stand-alone metric, and a useful companion metric to TTI.
Total Blocking Time vs First Input Delay
As noted earlier, TBT is a replacement for First Input Delay (FID), which is one of the Web Vitals. FID is a field-only metric that requires real user data to measure.
This real user data come in the form of Chrome User Experience Reports (CrUX) – Google's database of Chrome Browser behaviour collected from real-world Chrome users, something GTmetrix doesn't use in its testing.
GTmetrix reports Total Blocking Time in place of First Input Delay.
Therefore, GTmetrix tests report TBT in place of FID as it serves as a suitable proxy and recommends the same optimizations. You can read more here.
Total Blocking Time's effect on your Performance Score
As a Web Vital metric, TBT accounts for 25% of the Performance Score, making it a top metric to optimize.
This highlights our increased focus on user experience to complement page speed analysis.
What this means for you is, optimizing your TBT can often make one of the most impactful improvements in your website's responsiveness.
Thresholds for Total Blocking Time
Total Blocking Time measures the total amount of time between FCP and TTI when the page is blocked from responding to user input and displays the result in milliseconds.
TBT thresholds are, as follows:
- Good – nothing to do here = TBT of 150 milliseconds or less.
- OK, but consider improvement = TBT between 150 and 224 milliseconds.
- Longer than recommended = TBT between 224 and 350 milliseconds.
- Much longer than recommended = TBT higher than 350 milliseconds.
How to improve Total Blocking Time?
*Note* that the particular audits mentioned below likely contribute the most to your TBT; however, your page's Total Blocking Time may also be affected by other optimizations that aren't mentioned here.
Total Blocking Time is highly correlated with JavaScript performance, and any improvements to JavaScript execution (in general, optimizations that improve TTI) are likely to reduce your TBT.
Some of these optimizations include:
- 1) Reducing JavaScript execution time
- 2) Minimizing main-thread work
- 3) Removing unused JavaScript
- 4) Reducing the impact of third-party code
- 5) Replacing large JavaScript libraries with smaller alternatives
Note: Some of the Structure audits are related; improving one is likely to improve the others.
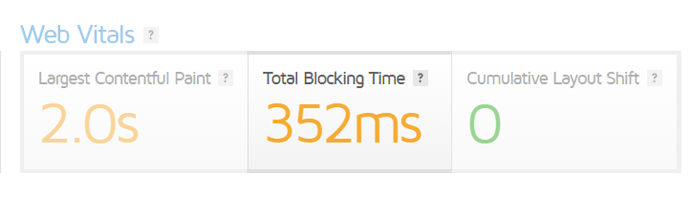
Lighthouse: Web Vitals
Overview
Google introduced a new concept in 2020 called "Web Vitals", which focuses on a small set of key metrics to assess your page experience.
With so many timings and audits to assess for page performance, this small set represents the most impactful metrics to focus on, in the interest of simplifying the world of web performance.
Each metric represents a key facet of the page experience, namely loading, interactivity, and visual stability.

Web Vitals essentially measure your page for 3 key criteria that define a fast performing page.
Web Vitals' importance is further emphasized by the fact that they make up half the metrics in the Performance Score calculation.
How does your site score on this metric?
Analyze
What are the different Web Vitals?
Web Vitals in GTmetrix focus on three Performance Score metrics, namely:
Note that TBT is used in-place of First Input Delay (FID) as GTmetrix is a synthetic test and FID is a field-metric only available with Chrome User Experience Reports (CrUX).
Why are Web Vitals important?
There are a whole host of performance metrics available and it may be difficult to understand which ones to analyze and optimize, unless you are an advanced developer.
Web Vitals serve as a simplified benchmark for user experience in terms of perceived performance, interactivity and delightfulness.
This smaller set of metrics should be the first to focus on when you consider your page performance.
Additionally, Web Vitals are representative of what your visitors first see in their viewports when they visit your page i.e., above-the fold content. What they see first ultimately influences their perception of your page's performance.
Focusing on these three metrics first allows you to yield size-able gains in perceived and actual performance, before needing to dig deeper into other optimizations.