
https://raygun.com/blog/react-debugging-guide/
A complete guide to getting started with React debugging
By Juho Vepsäläinen | Posted Oct 15, 2019 | 8 min. (1601 words)
Debugging is the art of removing bugs — hopefully quickly, and in this guide, I’ll show you multiple ways to debug React. In terms of React, we can have many different kinds of bugs, including:
- User interface bugs — something’s wrong in the user interface, or it just doesn’t look right
- Logic bugs — the application doesn’t behave the way we expect
- Networking bugs — although the logic is correct, a third-party service doesn’t behave as we expect
- Regressions — a feature that worked in the past doesn’t work anymore
There are more categories than this, but it’s enough to get started debugging in React. Let’s open by talking about how to create a small application using React and how to debug it.
How to install Node.js and npm
Before getting started, make sure you have a recent version of Node.js and npm (the package manager) installed. I recommend going with the most recent LTS (long-term support) version. Since npm is bundled with Node.js, you won’t have to install it separately.
To ascertain that you’ve installed Node.js correctly, run node -v in your terminal. You should see something like this:
$ node -v
v10.15.1
We’re ready to create our project now.
How to bootstrap a React project
To get started, let’s bootstrap a project using Create React App. It’s a popular project, especially for learning React. That’s because it encapsulates many of the development-environment-related best practices.
To create a React project, run npm create-react-app counter-demo. The process will take a while, as it will create a counter-demo directory and install all the dependencies needed.
Head to the directory (cd counter-demo) and execute npm start. Doing this will open a new tab in your browser, and you should see the starter application there. The next step is to add something to debug there.
How to create a counter application with React
To keep things simple, I won’t teach you how to use React. After all, the official React tutorial covers that need well enough.
Instead, I’ll get straight into creating a counter application. To follow along, paste the following code adapted from React hook documentation to src/App.js:
import React from 'react';
import './App.css';

function App() {
  return (
    <div className="App">
      <Counter />
    </div>
  );
}

function Counter() {
  const [count, setCount] = React.useState(0);

  return (
    <div>
      <p>You clicked {count} times</p>
      <button onClick={() => setCount(count + 1)}>
        Click me
      </button>
    </div>
  );
}

export default App;
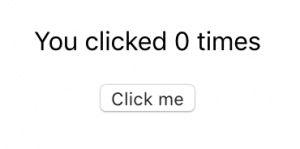
After pasting the code to the file, you should see a button labeled “Click me”. Pressing it should increment the value visible above the button. See the image below for what the application should look like after it’s running.
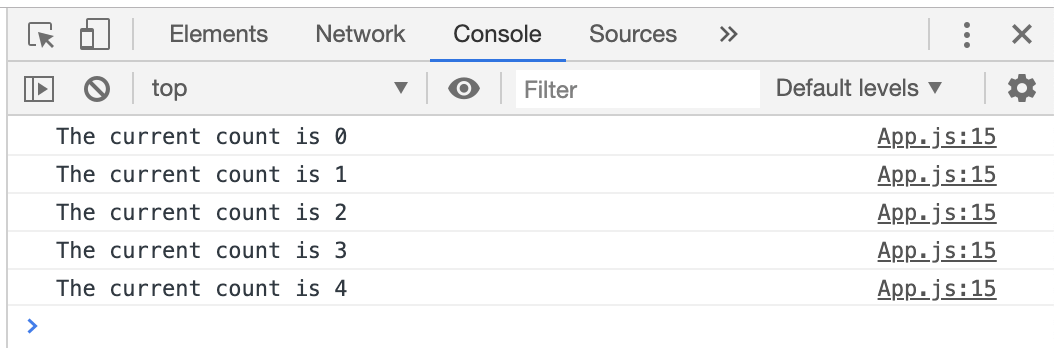
How to debug React using Console statements
One of the classic ways to debug an application is to log it. In the web, you can achieve this by using console.log, console.warn, console.error, and similar statements. Then, to examine application state, for example, you would do console.log(count). You’ll then see the result in the browser inspector. Developers use this method because it’s fast to implement and it relies on your reasoning skills. That said, using a browser inspector is a more powerful approach since it gives you a better picture of what’s going on.
Now, you might be wondering how to open the browser inspector. The inspector won’t be shown by default; you have to activate it either using a shortcut or a browser menu (usually named Developer or something similar).
How to debug React using the browser inspector
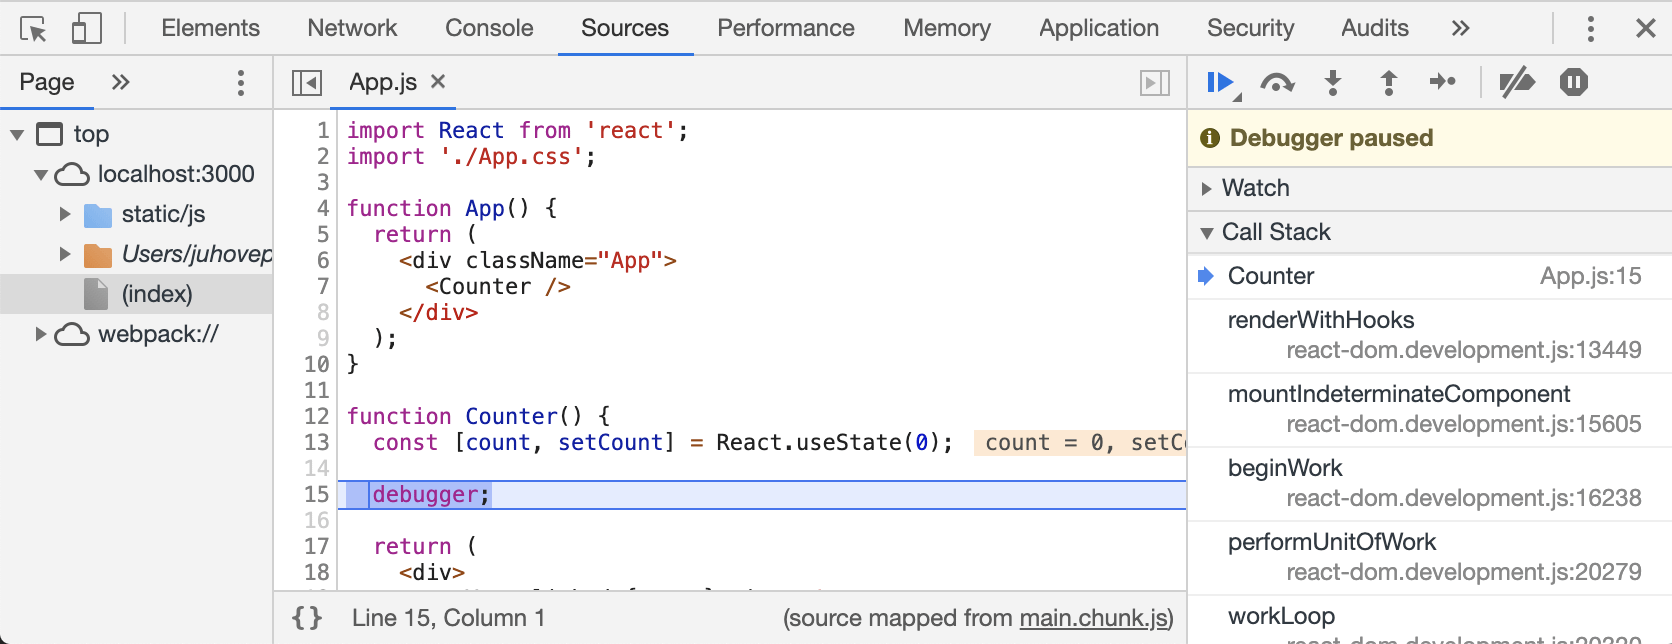
The browser inspector contains many powerful tools, including a debugger. It can be activated from the code by using a debugger; statement. Writing debugger; is the same as if you were adding a breakpoint to your code using the browser. Here’s what debugging using the browser inspector looks like:
To get started with this, do the following:
- Modify the code above so that you have a debugger; line within the Counter function. Place it after the line with const, for example.
- Open the code inspector of your browser, if it isn’t open already.
- Refresh the page.
- Note that instead of running the application, the browser will stop the execution. You should see Paused in debugger or similar wording. Also, the inspector should point to your code now.
Now that the application is in a frozen state, you can inspect it in various ways. Consider the following examples:
- Hovering over an already executed statement should show you the current value.
- You can step through statements one by one and dive into the execution of functions if you prefer.
- The browser shows you the call stack, which reveals how the code arrived in the spot you’re currently debugging.
There’s functionality beyond this, including value watchers. But the above is enough to give you some idea of how powerful debugging within a browser can be.
How to debug using React DevTools
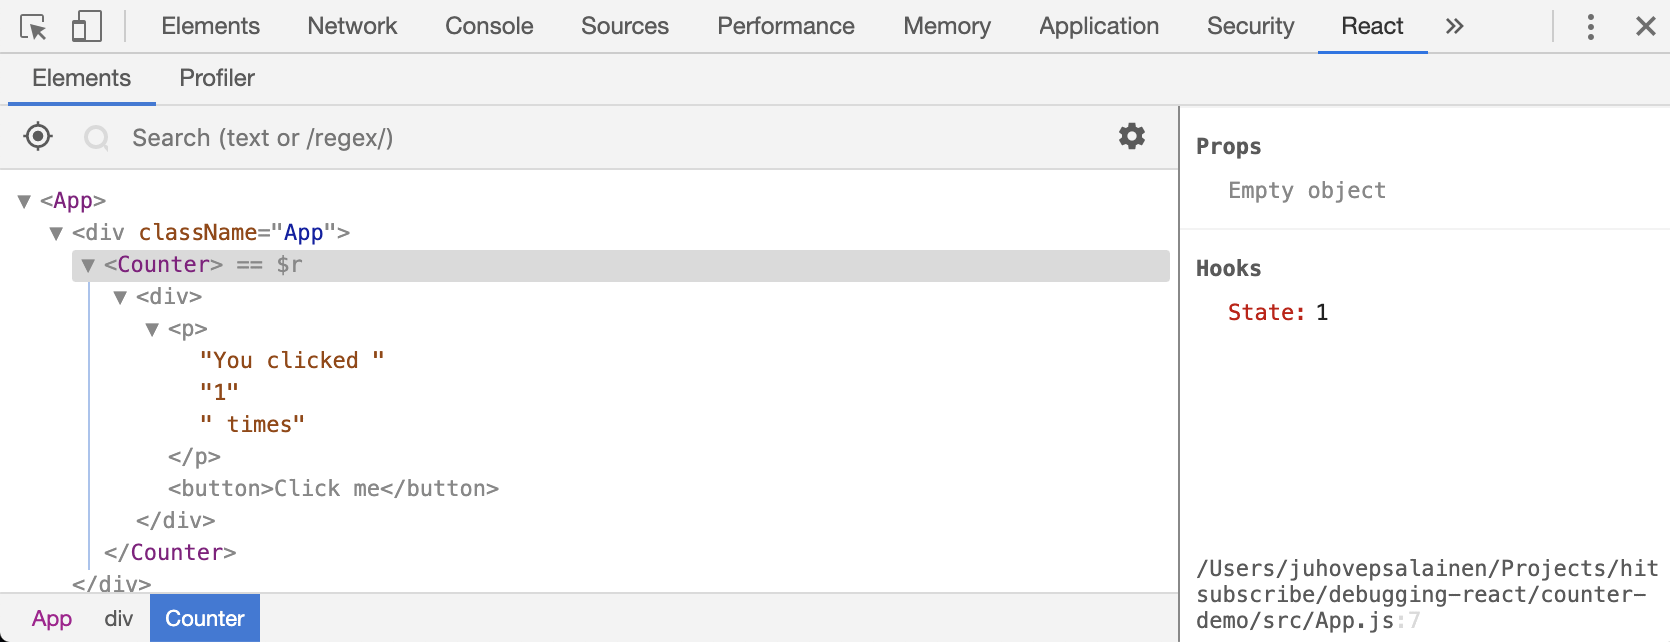
To debug React better, it can be a good idea to install React Developer Tools. It’s an extension for Chrome-based browsers and Mozilla Firefox that implements React-specific debugging functionality. After installing the extension, open the React tab in your browser. You should notice the Elements and Profiler tabs.
How to debug React Element Tree
The Elements tab of the extension lets you see the application element structure and the state associated with it. In the case of our application, you can see the current count if you click on the Counter element. It’s also possible to narrow down the visible elements using a search.
How to debug React performance
In order to debug performance issues, the extension comes with a profiler designed for React. The functionality complements browser functionality (i.e., the Performance tab at the inspector) while providing React-specific insights. To use the profiler, do the following:
- Begin recording a session by clicking the red circle
- Operate on the application (i.e., press the button a couple of times)
- To finish the session, press the circle again. As a result, you should see component-specific timings
In the case of this application, there isn’t much to see, but the functionality is valuable when you’re debugging something complex.
How to debug React networking issues
Usually, an application is connected to a remote backend. That brings a new source of bugs, as the data you receive from a backend might not be what you expect. Or perhaps you made a mistake in your query. To debug these sorts of issues, consider using the Networking tab of the inspector. You’ll see all sent network requests there, and you’ll be able to inspect their contents further.
Doing this work in tandem with another technique, such as inserting a debugger; statement into a good place, can be a decent way to debug these issues.
How to debug React and Redux
If you’re using Redux with your application, Redux DevTools Extension gives you insight into the state of your application at a given time. The extension also allows you to travel in time through different states. It requires a certain amount of setup in your application. but it’s all explained in the documentation of the extension.
How to debug React regressions
Assuming you’re using Git to manage the versioning of your application, there’s a special command that you can use to catch regressions in your application. If you know that a certain functionality worked in the past but is broken now, Git can help you to find the revision where the functionality broke. The command is called git bisect.
Bisection is a type of search where the search space is halved on every search. The way it works is as follows:
- First, you tell Git which version was a good one (meaning it worked) using
git bisect good. - Start the process with
git bisect start. Git will check out the middlemost revision and then ask you if the current revision is good or bad. (Answer with git bisect good or git bisect bad.) Before answering, you should inspect your application visually to determine this. - Eventually, you should reach a result as Git is able to pinpoint where the functionality broke. Now that you know where things went wrong, you can check the changes introduced in the commit and be able to reason better why it broke the functionality.
When bisecting, you should take care to npm install the correct versions for each commit. This is particularly important if the package version changed during the commits, as it’s possible package APIs have changed during updates. Bisecting is also one of the reasons why it’s a good idea to keep your commits relatively small and focused: it’s easier to reason about your code.
Final considerations
When debugging React, you should first determine what you’re debugging. Then, you can decide what techniques to use based on that. Debugging is usually an interactive process, in which you interrogate the application to gain insight into why the behavior doesn’t match expectations.
There are further ways to perform the above in a more automated manner. For example, you could use the React APIs to measure rendering performance while testing or use tests to assert certain behavior. After debugging a fault, writing a test to assert the new behavior can help you avoid regressions in the future.
One last consideration is runtime behavior. Before you can fix an issue, you have to be able to know about it. That’s where services like Raygun Error Tracking come in, as they’ll let you track what happens when the application is in the hands of the user. You’ll want to capture possible issues for developers to fix. After all, if you don’t know what to fix, you can’t fix it.