Clickety – Results
MORE TOOLS:
- Pingdom vs GTmetrix vs WebPagetest: How Are They Different?
- Why You Should Care About PageSpeed Insights
- How to Read the New Lighthouse Audit by PageSpeed Insights
- How to Correctly Measure Your Website’s Page Load Time
https://wp-rocket.me/blog/gtmetrix/
GTmetrix is one of the best alternatives to PageSpeed Insights when it comes to measuring the performance of your site.
At WP Rocket we use GTmetrix daily, along with other performance testing tools, to help our customers audit their sites and making the most of its recommendations.
While PageSpeed mostly focuses on colors and score to guide users through its recommendations, GTmetrix counts on a more classic interface, where its waterfall plays the leading role.
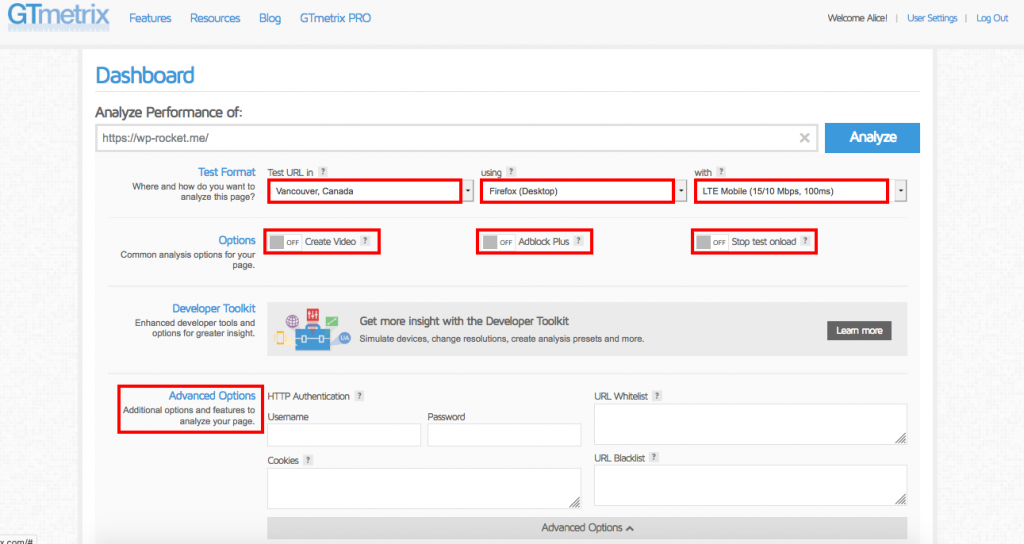
Several customization options (test server region, type of browser, etc.) make the experience with GTmetrix complete and reliable.
In this tutorial we’re going to deep dive into GTmetrix, and you’ll understand why it’s a very valid tool to assess the real performance of your website.
What Is GTmetrix and How Does It Work?
GTmetrix is the free performance testing tool built by the people of GT.net, a hosting company based in Vancouver, Canada. They provide dedicated, clustered, and private cloud hosting solutions, plus a specific toolset dedicated to performance: among them, there’s GTmetrix.
The first thing we suggest doing before running a performance test with GTmetrix, is to create a free account.
This allows you to customize your test and have a more reliable performance result.
How to Customize Your GTmetrix Test?
There are several options that you can tweak to customize your testing experience with GTmetrix. Let’s see them together.
Location (Test Region)
There are 30 test servers available to try. As we mentioned in our article about how to correctly measure your website’s speed, the first step to get reliable results for speed tests is to choose a location as close as possible to your server.
This means that if your server is located in Europe, testing your speed from Canada would give you a misleading result, unless you’re targeting Canadian audience, too. In this case, don’t forget to enable a CDN on your site!
You can find GTmetrix servers’ locations here.
Browser
You can choose between:
- Firefox for Desktop
- Chrome for Desktop
- Chrome for Android (Galaxy Nexus)
Connection
Now that Google switched to mobile-first indexing, being aware of how your site performs on different types of networks is crucial.
GTmetrix gives you several possibilities:
- Unthrottled Connection
- Broadband (slow, fast, and normal)
- 3G Mobile
- 2G Mobile
- LTE Mobile
- 56K Dial-up
AdBlock
With this option you can see the impact Ads have on your site. When you tick the AdBlock option, GTmetrix will scan your URL while ads are blocked.
You can check a real case example on GTmetrix’ site, where they used Smashing Magazine website.
Stop Test Onload
This will stop the speed test right after the Onload event, instead of after 2 seconds of network inactivity (which is the default for GTmetrix, and is referred to as Fully loaded time). The Onload event is when the overall processing of the page is over, and all the resources of the page have been downloaded.
The inconvenience of using this option is that, sometimes, not all the elements of the page are downloaded before the Onload event fires (think about JavaScript based images carousels, or similar behaviors)
As a result, page load times measured when this option is enabled could be inconsistent.
That’s why, by default, GTmetrix will test your site considering the Fully loaded time: it waits for the Onload event to fire (including ads and below the fold elements) and then waits for a network inactivity of 2 seconds.
It’s important to consider that a website can be perfectly usable in a shorter amount of time than that indicated by the Fully loaded time.
Create Video
If you want to see how your page loads exactly, you can enable the Video option.
GTmetrix will record a video where you’ll see your page loading 4x slower, so it would be easier to detect eventual loading issues.
How To Read GTmetrix Tabs and Interpret Their Results
Once you launch a GTmetrix report, you’ll see all the info concerning the performance of your site.
First of all, you have a summary of the testing options you chose:
The nice thing about GTmetrix is that it allows you to see several types of metrics, including those coming from other testing tools, like PageSpeed and Yslow.
That’s why you’ll see the external performance scores on the left (GTmetrix doesn’t calculate one of its own), and the page details on the right:
The page details are the most important and immediate info you can have on your website performance:
- Fully loaded time, expressed in seconds
- Total page size, in MB
- Number of HTTP requests
This is a great start to understand how your site is performing. 🙂
As we explained in our guide about page speed optimization for WordPress, different speed tools can provide different load times or performance results.
This statement becomes immediately clear when looking at GTmetrix’ tabs.
Here’s the list of recommendations in the PageSpeed tab:
And here’s how, the same website, scores under the YSlow tab:
Diving Into the GTmetrix Waterfall Chart
To dive deep into the details of your site’s performance, you have to click on the third tab and read GTmetrix’ Waterfall Chart.
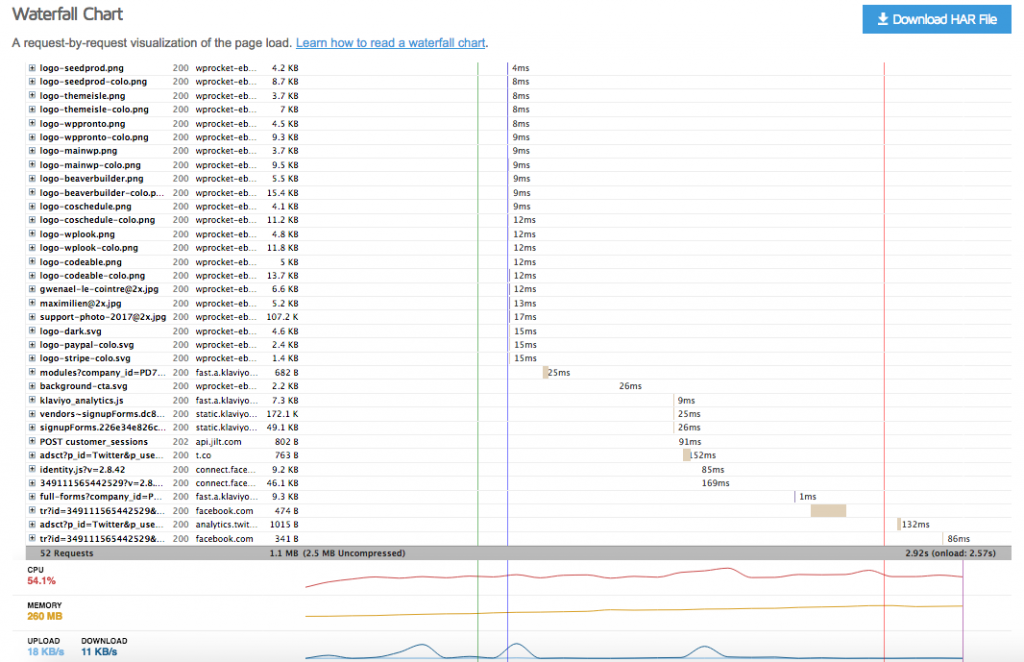
The Waterfall Chart describes the loading behavior of your page, by dissecting every request and measuring its timing.
It contains every script, media file or external resource included in the tested page.
This tab is very useful to have an idea of what resources your page loads, and in which order.
For every request you have its loading time, represented by horizontal bars: the longer the bar, the slower the request will take to download/execute.
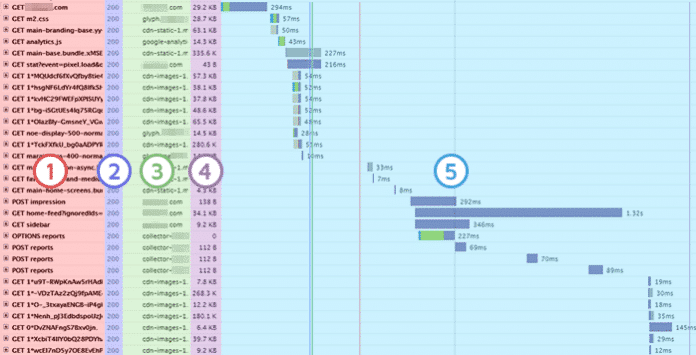
GTmetrix Waterfall Chart includes five columns; from left to right:
- File Name of the requested resources;
- HTTP Response Status returned from the server for that resource;
- File Origin, that is where the resource is coming from;
- File Size for each resource;
- Load Time Breakdown, which represents the time needed to download/execute each resource.
Source: GTmetrix Blog
If you hover the file name, you’ll be able to read the full path of the selected file. And if you Ctrl+click on it, you can open the file in another tab, to better identify it and see its content.
Since you’re using WordPress, it will be easy to understand if that file is coming from one of the plugins or theme you’re using.
At this point, you have in front of you a very clear picture of how well your site is doing.
Before proceeding to the load time breakdown section, keep an eye on the fourth column, File Size.
If you notice large file sizes here, note down the file and try to fix it: are they images or videos? In this case, have a look at our comprehensive guide on how to optimize images and reduce their file size.
Load Time Breakdown
The color code that GTmetrix designed is helpful to distinguish the different parts of the loading process for each resource.
Hovering on the load time bar for each resource will open a pop-up where the different phases of the resource’s loading process are expressed in different colors:
- Brown for blocking
- Teal for DNS lookup
- Green for connecting
- Red for sending
- Purple for waiting
- Gray for receiving
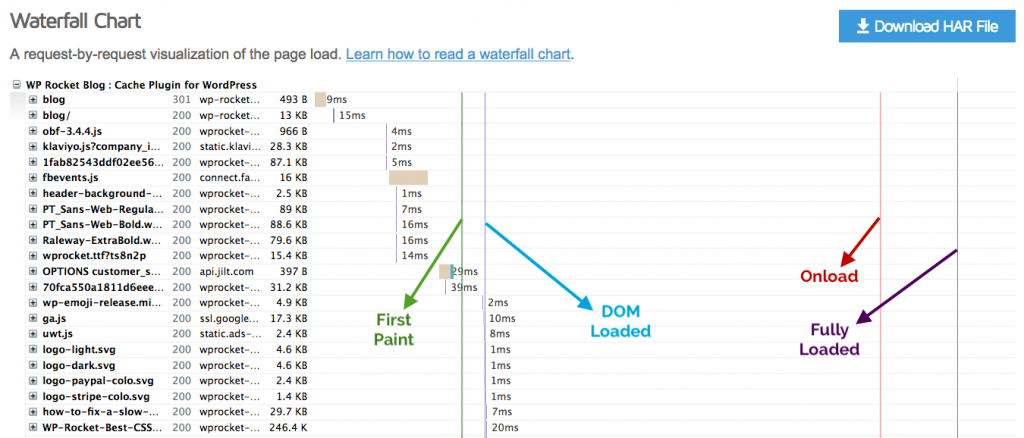
In addition to the relative time of each phase of the request execution, GTmetrix also indicates the event timing, which is the specific timing at which certain milestones are reached.
There’s a color code for event timings as well:
- A green line depicts the moment when the very first rendering begins on the page (first paint);
- The blue line indicates the moment in which the browser considers the DOM ready.
- The red line is the Onload, that is when the page and all its components have downloaded and are processed by the browser.
- With the purple line we see the fully loaded event: the Onload has fired and there hasn’t been any network activity for 2 seconds.
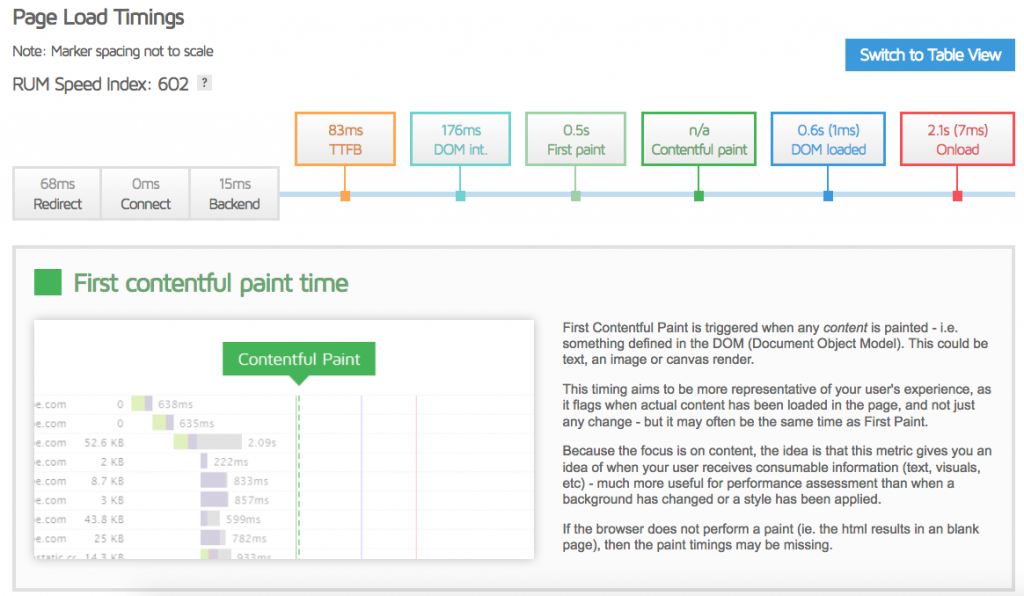
Some of these lines are represented also in the next GTmetrix tab, labeled as Timings.
The Timings tab
This tab is very helpful because it provides a clear and visual explanation of the different moments in which the loading time of your page is being split.
In the image above you can see the info included in it. You’ll have an indication of the time needed for eventual redirects, connection, and backend duration. Then you’ll be able to see how long the Time to First Bytes takes, followed by DOM interactive time, First Paint, Contentful Paint, DOM loaded and Onload.
What we like the most about the tab, is how GTmetrix team takes the time to explain the meaning of every metric, in plain English. Super useful to have a first grounding on the complex process of page loading!
The last two tabs of any GTmetrix report are Video and History.
The first one records a video of your page loading (bottlenecks included), while the second one shows the history of the performance of that same tested page.
Wrapping Up
In this article you got to know GTmetrix, one of the best performance testing tools that you can use as an alternative (or along with) PageSpeed Insights.
The good thing about GTmetrix is that it provides not only instant indicators of speed and performance (like loading time in seconds, and scores), but also a comprehensive set of tabs to explore: from the Waterfall Charts to the Event Timings, to the Timings tab, plus a bunch of great insights and explanations about performance indicators.
Table of Contents
- What Google PageSpeed Insights is And What the PageSpeed Score Means
- Why Google PageSpeed Is Important (and Why It Affects SEO)
- Is Google PageSpeed Insights Reliable & Accurate?
- Why the Google PageSpeed Score Isn’t Equal to the Loading Page Performance
- How Google PageSpeed Insights Score Is Calculated
- Google PageSpeed Insights Mobile vs. Desktop: What’s the Difference?
- How to Improve a Low Mobile PageSpeed Score
- What About PageSpeed Insights vs. Other Performance & Speed Test Tools?
- Wrapping Up
Last update on September 20, 2022
If you’re wondering if Google PageSpeed Insights score matters, our short answer is: yes. Google PageSpeed Insights grade is important (and reliable).
It hasn’t always been like that for us. In the past, we said that you shouldn’t care about the Google PageSpeed Insights score because the grade alone wasn’t an indicator of speed.
While there could still be a difference between the Google PageSpeed score and your site’s loading time, things have changed — and we need to keep up with the news.
Starting from June 2021, the Google PageSpeed score will be closely related to your SEO performance because of the Core Web Vitals included in the new Page Experience ranking factor.
In this article, you’ll learn why Google PageSpeed Insights is important and accurate to measure different aspects of your site’s user experience, including performance.
You’ll also understand why you should always pay attention to the loading time — Google PageSpeed Insights could still be a bit misleading, and at WP Rocket, we care a lot about this metric!
Lastly, you’ll get some tips to improve your mobile PageSpeed score, the most important grade.
You’ll get answers to all your most popular questions and doubts on the PageSpeed Insights importance, including the evergreen question: does the 100/100 page speed score matter?
What Google PageSpeed Insights is And What the PageSpeed Score Means
Let’s refresh the basics.
Google PageSpeed Insights is one of Google’s tools to measure and improve your site’s performance on mobile and desktop devices.
As the first thing, PageSpeed Insights provides you with the overall page’s performance score.
The Google PageSpeed score is determined by Lighthouse, an open-source tool powered by Google’s team. Lighthouse runs different audits, including a performance one. After running the performance audit and assessing several metrics, Lighthouse will determine the Performance score — that is the same score that Google PageSpeed provides.
The Google PageSpeed score is based on lab data. It means that Google PageSpeed Insights, through Lighthouse, collects performance data in a controlled environment. The simulation is done with the predefined device and network settings.
Being based on predefined conditions — for instance, the Internet connection — the Google PageSpeed score doesn’t reflect real user experience at 100%.
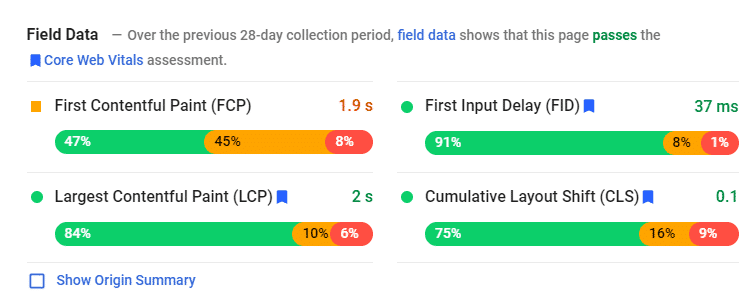 WP Rocket homepage – Example of Lab data
That’s why the PageSpeed Insights tool also provides Field data. Real field-data is based on the aggregated data that Google Chrome collects from users and makes available in the Chrome User Experience Report (CrUX).
This data is highly valuable because it captures real user experience — it’s also why this data can slightly differ from the lab data and isn’t always available.
Field Data stored in the CrUX contains all three Core Web Vitals. You can quickly identify them by the blue flag: Largest Contentful Paint (loading performance), First Input Delay (interactivity), Cumulative Layout Shift (visual stability).
 WP Rocket homepage – Example of Field data
At this point, it’s useful for you to know that the Lab data contains only the Largest Contentful Paint and Cumulative Layout Shift scores. The First Input Delay metric can’t be measured without real user interaction. That’s why the performance score considers the Total Blocking Time metric, used as a proxy.
Last but not least, field data is valuable because it’s how Google evaluates the SEO ranking — more on this topic just in the next section!
Why Google PageSpeed Is Important (and Why It Affects SEO)
Google PageSpeed matters because it can affect SEO from two different perspectives: mobile speed and user experience.
Both mobile performance and user experience are related to specific ranking factors:
- In July 2018, Google rolled out the Speed Update, and mobile page speed became a direct ranking factor, both for Google Search and Ads.
- In June 2021, the Page Experience signal will roll out as an SEO ranking factor. This new ranking factor measures the user experience of a page. It includes several signals: mobile-friendliness, HTTPS-security, intrusive interstitial guidelines, safe-browsing, and the already mentioned Core Web Vitals metrics.
On the one hand, mobile page speed has been a ranking factor for more than two years. Hopefully, you’re already taking care of your site’s mobile performance. If you’re still in doubt, we’ve got you covered in the last section of this article with some performance optimization tips.
On the other hand, the three Core Web Vitals focus on how users interact with your page and account for 70% of the overall PageSpeed score weight. Meaning, they’re quite relevant in determining the PageSpeed Insights score.
Even though the Google PageSpeed score as a whole is not a ranking factor, you need to take care of the Core Web Vitals metrics. As we said, they’re part of the new Page Experience ranking signal and will affect your organic visibility.
You can find below the score required for each Core Web Vital. You should start thinking about how to enhance them! (Hint: WP Rocket is the easiest way to improve your Core Web Vitals in a few clicks).
 The scores for each Core Web Vital
Is Google PageSpeed Insights Reliable & Accurate?
Yes, Google PageSpeed Insights is now pretty reliable and accurate when measuring the full user experience on your site. Thanks to the different metrics included, it gives you an accurate overview of how users interact with your site.
The tool became more and more reliable thanks to the latest changes.
In November 2018, Google released PageSpeed 5.0. The new version started to use the Chrome User Experience Report dataset (CrUX) mentioned above. It also started to use Lighthouse audits.
Then, in May 2020, Lighthouse 6.0 arrived. New metrics have been added — the same ones that you now see in the PageSpeed Insights tool and capture the overall performance and user experience.
That’s why you can rely on the PageSpeed score and its metrics to understand how your site performs. And, of course, you should follow the PageSpeed Insights recommendations to improve your score.
Since the Google PageSpeed score is now more accurate, an improvement in the grade would usually reflect an improvement in the loading time.
Wait… does it mean that the PageSpeed score doesn’t reflect how fast a website is? The honest answer is: it depends.
Why the Google PageSpeed Score Isn’t Equal to the Loading Page Performance
At WP Rocket, we care about educating users on web performance and giving them the best tools to understand how to approach this complex topic.
That’s why we want to point out that the Google PageSpeed score could not reflect how fast your website is.
To be clear: you can have a good PageSpeed score, but your site could not be as fast. Or you can have a fast website and a bad PageSpeed score.
We’ll share a couple of examples — you might relate to them!
- Following the PageSpeed Insights recommendations won’t always make your site faster. ** **Let’s take the popular recommendation of removing render-blocking JavaScript. If you solve this issue, your PageSpeed score will improve. However, if you measure your loading time with Pingdom, you won’t necessarily notice an improvement.
- The more your PageSpeed score is low, the more the loading time will improve — but don’t expect proportional enhancements.If your Google PageSpeed score jumps from 10 to 90, it’s quite likely that your loading time will improve — let’s say, it will decrease from 2s to 1.5s. If your Google score jumps from 80 to 90, your loading time will only decrease slightly — for instance, from 2s to 1.9s.
It’s because the Google PageSpeed score reflects an overall user experience more than the loading time.
The loading time is just the page loading time. On the other hand, the Google PageSpeed score takes into account six metrics that go beyond that.
In the next section, we’ll share practical examples to explain how the Google PageSpeed score is calculated. You’ll see how the metrics play together for both performance and user experience.
For now, keep in mind that you have to take care of both loading time and Google PageSpeed score. They both matter for different reasons:
- If your loading time is high, you’re likely to lose users and conversions.
- If your PageSpeed score is not good, likely, the Core Web Vitals metrics won’t be good as well. And your site will be penalized from an SEO perspective. Don’t forget: Core Web Vital accounts for 55% of the PageSpeed score.
How Google PageSpeed Insights Score Is Calculated
We’ve seen how the Google PageSpeed score is relevant for SEO performance. Let’s now take a closer look at the metrics that can make a difference in your grade.
As we said, the speed score that you see on the top of your PageSpeed report is based on the lab data analyzed by Lighthouse.
What’s a Good Google Pagespeed Score?
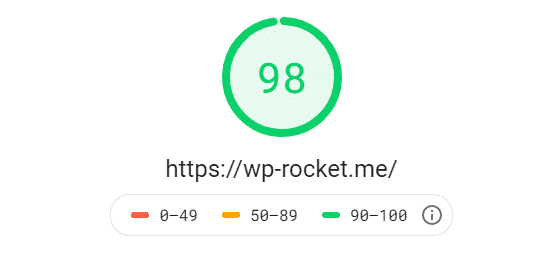
If you’re wondering what Google PageSpeed grade you should aim for, you should know that a good score starts from 90 — the threshold giving you the green color.
The score is divided into three buckets:
- Good: your score is 90 or above (green)
- Needs improvements: your score is 50 to 90 (orange)
- Poor: your score is below 50 (red).
PageSpeed Insights Metrics and Weights
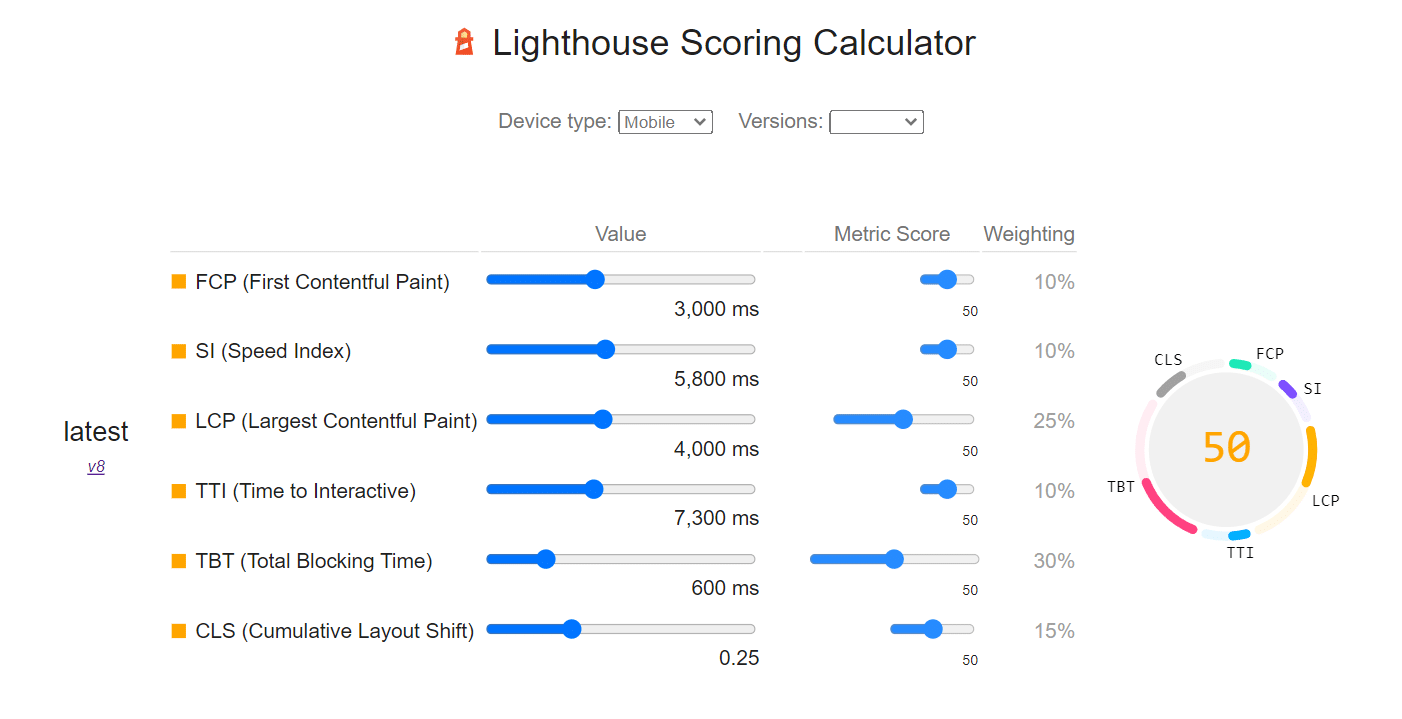
The Google page speed score includes six metrics:
- First Contentful Paint
- Largest Contentful Paint (Core Web Vitals metric)
- Speed Index
- Cumulative Layout Shift (Core Web Vitals metric)
- Time to Interactive
- Total Blocking Time (As we saw, it replaces the First Input Delay, the third Core Web Vital metric that can’t be measured in the lab).
It’s essential to know that each metric has a different weight.
There are metrics that are more important than others for determining your overall score. Improving some of them will have a more significant impact on the score than others.
Here you can see how the weight is calculated:
Speaking of Core Web Vitals, you can see that the Largest Contentful Paint and the Total Blocking Time are the metrics that make the biggest difference. They both account for 55% of the overall score.
If you have a terrible Largest Contentful Paint or Total Blocking Time, it’s also likely that your loading time will be quite high. It’s because these two metrics relate to the loading performance and the interactivity of the page.
Take a look at how bad the performance score gets if you increase your Largest Contentful Paint or Total Blocking Time performance:
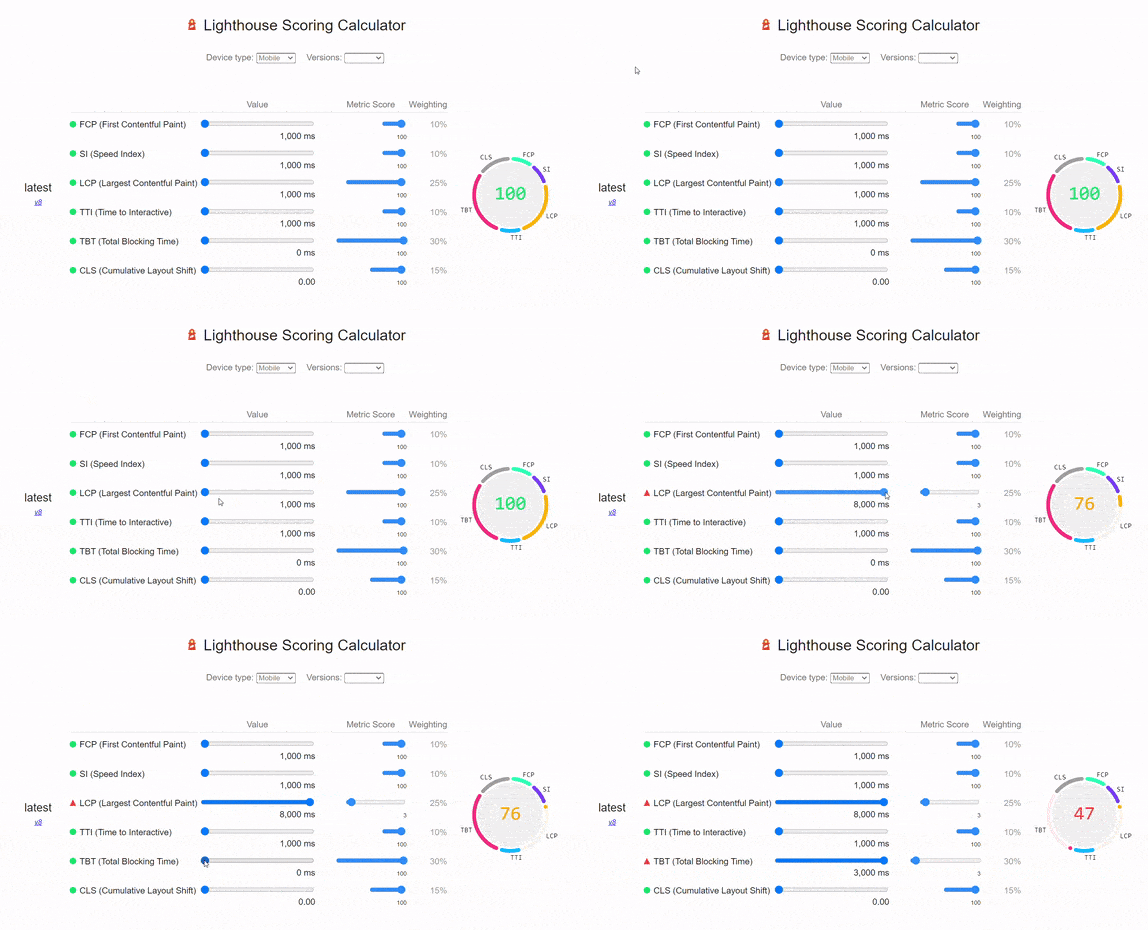 How the performance score changes according to LCP and TTB
By improving both metrics, your loading time will also decrease. How much it will decrease depends on your initial score — as we explained in the examples above.
In June 2021, Lighthouse 8.0 increased the weighting of the Cumulative Layout Shift metric, which now accounts for 15%
You now understand what metrics matter the most for your SEO and performance optimization. It’s time to get some good results and quickly improve both Core Web Vitals and loading time in one-go!
Don't Miss Out!
The Core Web Vitals Cheat Sheets are the easiest and fastest way to learn how to optimize LCP, FID, and CLS and prioritize your performance tasks.
Yes, I Want This!
Google PageSpeed Insights Mobile vs. Desktop: What’s the Difference?
The only difference between Google PageSpeed Insights mobile vs. desktop is the score you can get. Getting a good PageSpeed mobile score is more complicated than achieving the same score on a desktop.
It’s because the connection on mobile is slower. Simple as that.
By default, Lighthouse simulates a 3G connection. Comparing the mobile score to the desktop-grade is unfair. The desktop connection will always be faster.
There are also other reasons why your mobile score tends to be lower than the desktop one. Let’s go over them and see how you can improve your performance from mobile.
How to Improve a Low Mobile PageSpeed Score
Do you have a low-performance score from mobile? Image optimization could probably be the key to solve your issues.
You’ll solve a bad mobile performance following two overlooked best practices: resizing and serving correct images for mobile devices and optimizing images’ sizes (not just dimensions!).
Here are a couple of practical examples:
- Let’s say that you have a slider containing a big and large image — around 2000 pixels. The image would be fine from the desktop, where the average width resolution is 1900 or 1400 pixels. On the other hand, the maximum width on mobile is 700 pixels. The image’s dimensions will have a substantial negative impact on mobile. And it will add up to the issue about the 3G connection.
That’s why you should always load the correct size depending on the device and then serve scalable resized images on mobile.
- The size of image files can also cause lower mobile performance. If you optimize an image from 1 MB to 500 KB, your page will be faster. The lower your page size is, the faster the page will load. It’s especially true when you have a slower connection.That’s why image optimization will always have a more significant impact on your mobile score than on the desktop one. The worse your connection is, the more critical image optimization is.
Does It Matter to Get a 100/100 Google PageSpeed Score on Mobile?
We’ll be as honest as possible. It’s almost impossible to get a 100 score mobile for the reasons explained above. It’s easier to get such a score on a desktop.
The truth is, there is no difference between the 95 and 100 — both for mobile and desktop. As for the Web Core Vitals performance, your goal should be to get a green score. And the green score starts from 90 — it will be enough.
Don’t stress out! Google is not going to penalize you because you have a 97 score instead of 100. The user experience will be the same — and it’s everything that matters. But… if you still want to score 100% on Google’s Page Speed test, check out our case study and learn the best speed tips!
What About PageSpeed Insights vs. Other Performance & Speed Test Tools?
Let’s take a look at two of the main performance and speed tools. You’ll have another proof the Google PageSpeed Insights is a reliable tool and that loading time is a slightly different metric.
GT Metrix vs. Google PageSpeed Insights
The difference between PageSpeed insight and GTmetrix is the location used for the performance test. They both use the Lighthouse performance metrics now, so the score should be the same.
Still, you might see a discrepancy between the two scores.
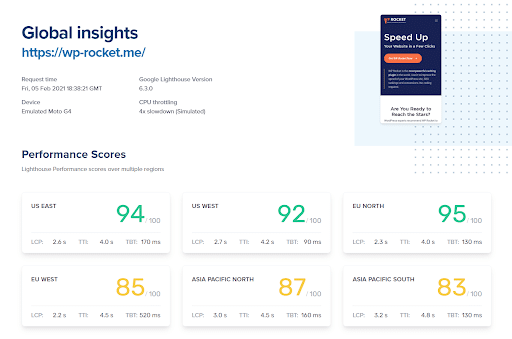
That’s because the closer your server is to the location of the server used to perform the test, the highest the score will be.
On the one hand, Google PageSpeed Insights will calculate your score using the nearest server. On the other hand, if you don’t have an account in GTmetrix, you’ll use the default server located in Vancouver.
If possible, you should always run your speed test by choosing your nearest location.
You can see how your performance score can change according to the server location:
The performance score can vary according to the server location
Google PageSpeed Insights vs. Pingdom
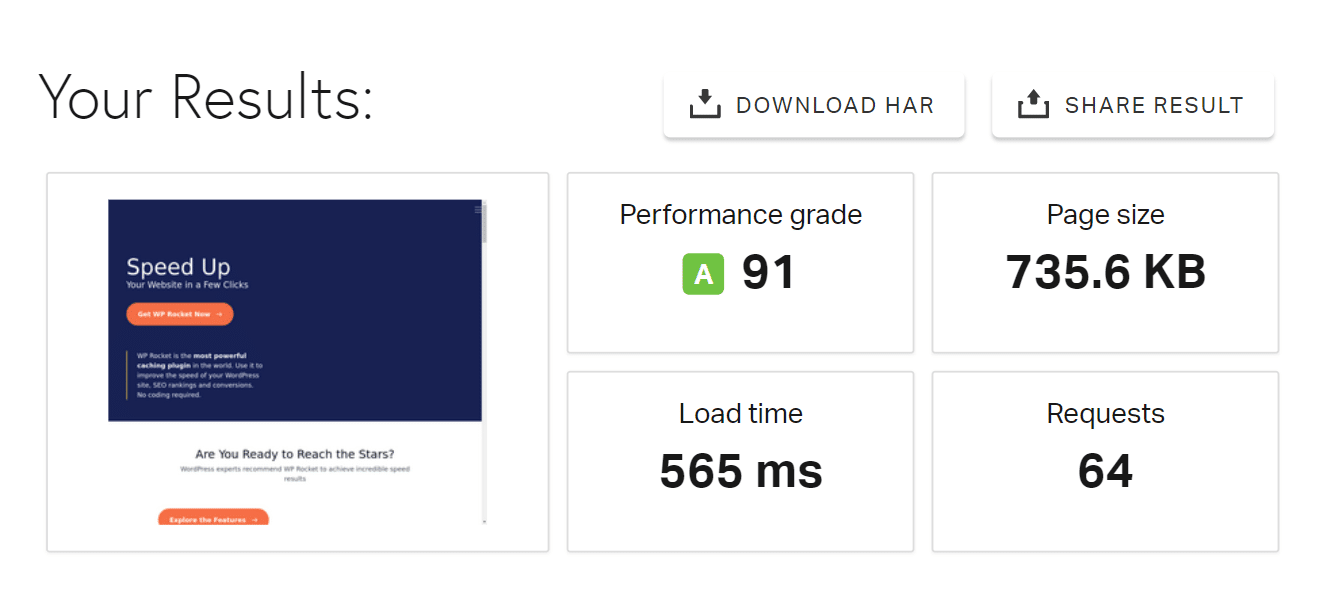
You can’t compare Google PageSpeed Insights and Pingdom. Pingdom doesn’t use Lighthouse, and it doesn’t give any information on Core Web Vitals.
It just provides a grade based on the loading time.
That’s why you should always take a look at Pingdom. It’s a different thing. As we saw, you need both performance and loading time scores to give your users the best experience.
Wrapping Up
Google PageSpeed Insights has evolved quickly. It gained undeniable importance thanks to the Core Web Vitals, which will make a difference in your organic performance very soon.
Google’s tool is reliable, and now you know how to look critically at the performance score and each metric — without forgetting the loading time!
Learning something more about testing web performance helps you understand what the priorities are and what your approach should be. Good luck with the new ranking factor rolling out!


