
Creating Custom Reports in Google Analytics
18 Best Ways to Create and Use Custom Reports in Google Analytics
Data is essential for businesses to thrive and grow.
According to a Mckinsey Global Institute, data-driven businesses are 23 times more likely to acquire customers and 19 times more likely to be profitable.
But, with a plethora of data available via Google Analytics, tracking and analyzing all of it can be a daunting task. Not only is it a time-consuming process, but a lot of that data is completely useless for your business goals.
So what’s the best way to make the most out of Google Analytics data without losing your mind in the process?
Creating and using custom reports.
And that is precisely what we’re going to discuss in this guide. Learn the following,
- What is a custom report in Google Analytics?
- What should be included in a Google Analytics report?
- How to create a custom report in Google Analytics?
- 18 best ways to create and use custom reports + dashboard examples.
So if you’re tired of wading through tons and tons of Google Analytics data, read on.

What is a Custom Report in Google Analytics?
If you’re new to Google Analytics, you’re probably wondering what a custom report is.
There are 3 types of reports in Google Analytics – Custom reports, Standard reports, and Saved reports. According to Google, a Custom Report is a report that you create according to your preferences. You pick the dimensions (City and Browser, for example) and metrics (Sessions, Pageviews, and Bounce Rate, for example) and decide how they should be displayed.
Since there’s a lot of data available to businesses, picking and choosing the data that matters most to your business and customizing it to be displayed in a custom report is very convenient. It helps to cut through all the noise and just focus on data that’s most important for your business and marketing goals.
Editor’s Note: Want to view your important website engagement metrics at one glance? Use this free Google Analytics Website Engagement dashboard template to track your most important website engagement metrics, including average time on page, bounce rate, average session duration, the number of unique visitors to your website, and % returning visitors and goal conversion rate.

Most businesses prefer custom reports over standard reports in Google Analytics. According to a recently conducted survey, a whopping 73.4% of respondents said they preferred creating custom reports.

Related content: The 10 Most-Tracked Google Analytics Metrics [Original Data]
What Should be Included in a Google Analytics Report?
“To create useful custom reports, you have to think about the questions you are interested in. With the right questions in mind, you will no longer spend hours with unguided searching in Google Analytics.” Says Bernadett Dioszegi of Bannersnack.
Google Analytics reports depend on your business and website goals and the different data you’re looking to collect and analyze. As Charlie Tatum of Online Optimism shares, “In addition to looking at overall website analytics, I find it beneficial to create a filtered report that looks only at the traffic and performance of blog posts. Because these posts serve a different function than service or other pillar pages, it’s important and useful to look at page views, time spent on page, and conversions driven by blog views. This helps our team grow our content strategy and make changes regularly.”
However, a basic report definitely needs to have customer acquisition metrics, behavioral metrics, and result metrics—a complete picture of what’s happening on your website.
You can also combine custom reports with other sources of information like SEO, eCommerce, etc. As Andreas Cederblad of Ngine Group AB says, “We try to involve, ToMoBeFeBeBa and Ds (Top, middle, bottom of the funnel and Front/backend and for other business analysts and data scientist), as well.”
How to Create a Custom Report in Google Analytics?
Creating a custom report in Google Analytics is really simple.
- Go To Google Analytics.
- Click Customizations, and then Custom Reports.

- Click on New Custom Report to start creating your own reports.

- Add in all the important information like the metrics you’d like to track, how you’d like to view your reports, dimensions, and hit Save.

Your Custom Report is complete. You can now track and analyze this data through Google Analytics.

To make it easier for you, Google also has a Google Solutions Gallery where you can choose from several crowd-sourced custom reports and dashboards.
18 Ways to Use Custom Reports in Google Analytics + Dashboard Examples
With so much analytics data available at your fingertips, you need to ensure you’re focusing on the data that matters most to your business. Cutting through all the unnecessary noise on Google Analytics is imperative.
And the best way to do that is by creating custom reports of crucial metrics.
We asked 28 marketing professionals and Google Analytics users the best ways to use custom reports, and here’s what they said.
- Visits by different companies
- Time and hour of the week
- Promotional data
- Traffic
- Store speed
- Media referrals
- Site performance
- 404 page
- Mobile performance
- Blog conversions
- Brand search
- Campaign costs
- Visitor acquisition efficiency
- Events
- Social referrals
- Top movers
- Map overlays
- Browser
Visits by different companies
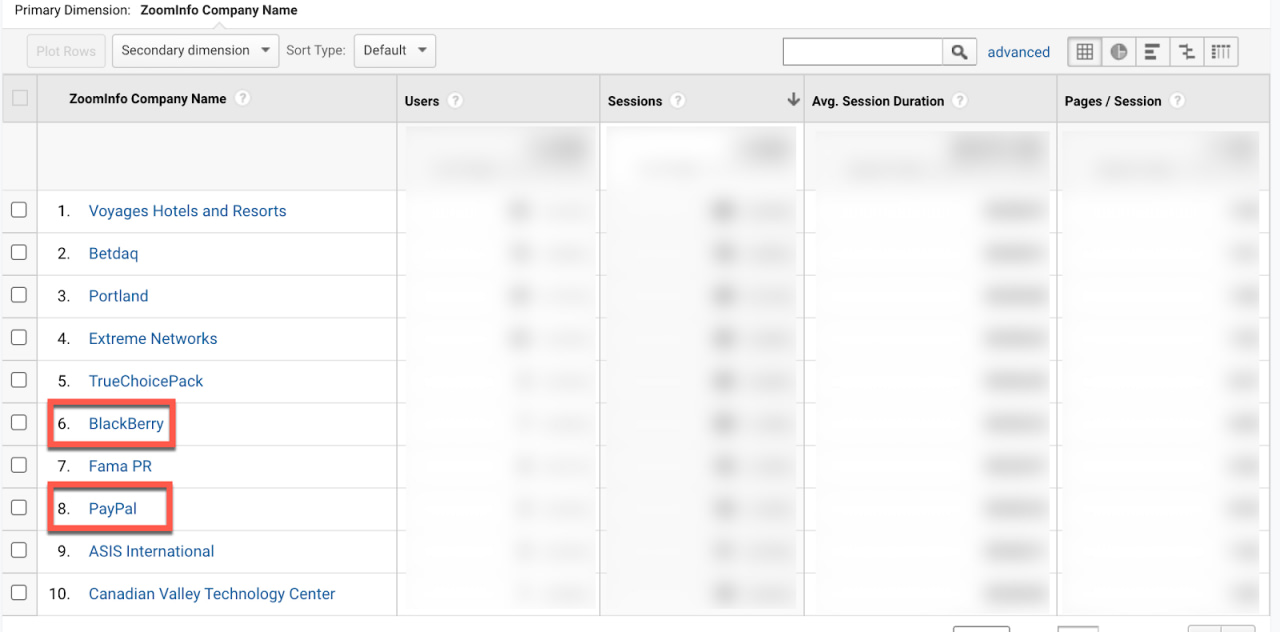
“We use a custom report to show visits from individual companies. We do this by using Custom Dimension data provided by ZoomInfo (required a paid contract).
The report of these Custom Dimensions lets us see how many times users from Amazon, PayPal, Blackberry, and others visit our website.
Once the custom dimension is added to your GA account, you can filter all traffic by that dimension to see all the standard GA metrics from each company: sessions, users, session duration, referral sources, etc.” TJ Kelly of FansRaise says.
Time and hour of the week
“This report tells our team what time most of our customers are online. This is very helpful to us because it helps us determine the best time to post on social media or post about a sale.” Explains Taylor Roberts of Movers Chicago.
Breadnbeyond’s Andre Oentoro agrees and says, “I created a custom report which I called ‘Hours & Days Traffic Report.’ It helps me to investigate what visitors are doing on our websites by hour of the day and day of the week. In other words, it makes it easier for me to determine when your traffic time periods are high and low. The hour of the day custom report gives us an insight into the best time to post new content. Meanwhile, we use the day of the week analytics data to determine when to make content updates and improvements (especially for the days that have low traffic) to reach out to more traffic.”
Promotional data
“For our eCommerce clients, we might create a custom report with custom metrics that show the number of times a pop-up banner (like a promotion banner – 20% off for email) appeared vs. how many times that pop-up was completed (converted).
This way, we can test different pop-up promotions to see what’s more effective (a $ amount off versus a % off).” Shares Jason Berkowitz of Break The Web.
Traffic
“I frequently use a custom Hourly Traffic Report in Google Analytics. This custom report lets me determine high-traffic website times for any selected time period and can provide insight into staffing hours for sales teams.
For example, I recently used the report to inform the leadership team of two weeknights that have been consistently busy over the past year so we could potentially stagger shifts during those days to keep the phones manned an extra hour.” Tony Mastri of MARION Marketing Firm says.

Adam Jackson of Big Leap says, “I love to create custom reports to track traffic from social, local, and other listings I control. With the use of UTM parameters, I can pinpoint the success of my efforts much more accurately than automatic reports, and I can track that user behavior in greater detail on my site.
These kinds of reports have helped me determine the true quality of traffic for each separate UTM installation. I have been able to stop or double down on certain marketing efforts.”
Colton De Vos of Resolute Technology Solutions shares that his team uses a ‘Filtered Traffic – Weekly Recap’ custom report. “It contains at a high-level summary of weekly stats for:
- numbers of sessions
- numbers of users (returning and new)
- conversions sorted by type (new business requests, newsletter sign-ups, etc.)
- top-performing pages
- search queries users found us by
- referral sources/mediums
This report gives us an ongoing sense of how our digital marketing initiatives are doing and that they are meeting our success metrics.
We can also determine if a particular traffic source, page, or search term has had drastic change – positively or negatively. This acts as the alert to go in and see what has caused the change. Getting this report and investigating the changes on a weekly basis versus a longer timeline allows our team to stay nimble and catch any problem areas or expand on opportunities quickly.” Explains De Vos.
Katheriin Liibert of Outfunnel shares, “I use a super simple saved report to keep an eye on the traffic that our content marketing efforts are bringing. It’s a report that shows all of the google/organic traffic by ‘landing page’ (blog articles), but I’ve excluded other parts of our website, such as the features page, careers, pricing, and our main page outfunnel.com.”

Store speed
M. Alexander Krzyston of Zorbies says, “We created a custom Store Speed report which shows the page load times of landing pages based on unique pageviews. The reason for this report is to understand what our slowest loading landing pages were so we could focus on optimizing those pages with the highest value. Slow page load times can increase your bounce rate and decrease your conversions. It helps us to prioritize which pages are the most important to optimize first and look into more depth why it might be loading slowly (e.g., having large media files that needed to be compressed).”
Media referrals
Sam Ficek of Nomadic Sam shares, “I have a ‘media referrals’ report that I use to keep track of traffic and conversions that have come from a filtered list of referring domains (Guardian, SMH, news.com.au). Each time we get a new piece of coverage, we add the domain to the regex filter rule. This is one of the ways we can measure the effectiveness of PR activity, and see the data at a glance in one report.”
Site performance
“The ‘Site Performance Dashboard’ is a useful way to display the performance speeds of your website.
After logging on to a client’s website, you can quickly discover page speed issues on different browsers, countries, and popular pages. By identifying the issues with these filters, it’s easy to target specific issues on a website.
For example, in the screenshot, the Safari browser, as well as average traffic coming from the United States may be having issues, which can be looked into deeper.” Explains Ben McLaughlan of Easy Mode Media.

404 page
Luke Fitzgerald of Ding says, “I regularly use a custom 404 page report to determine whether any of our global visitors are hitting 404 pages so we can report back to our technical and UX teams to resolve any issues with dead pages or broken user journeys.
The screengrab below shows what the custom report settings look like within GA, and it takes no more than a minute to configure for your own domain.

You simply enter the title for your 404 page on the ‘page title’ filter. You’ll then get URLs looking something like this in the report: ‘/404.html page=/pageonyourwebsite/&from=https://externalwebsitelinkingtobrokenpage/’
Once that’s configured, it’s worth checking in regularly to ensure no new 404s are cropping up and that the old ones remain fixed, keeping your users happy and avoiding any potential bounces along the way.”
Sasha Matviienko of growth360 agrees and says, “One of the all-time favorite reports we use in Google Analytics, especially for large eCommerce SEO clients is a 404 page report, sent to the team weekly. It helps identify broken pages and pages that users and search engine crawlers are trying to access but can’t.
From there, our SEO team has an option of either setting up a 301 redirect to another relevant page or identifying the source of traffic and reaching out to webmasters to fix the link.”
Related content: Broken Link Building Tips for Increasing Search Rankings, Authority, & Traffic
Swati Chalumuri of hearmefolks.com is a big fan of 404 Pages Report. “The metrics help in weeding out internal links that are broken as well as affiliate URLs that are no longer valid. I find this very important since not every user is conversant with broken links – and the moment they come across the dreaded 404 error, they leave and never come back.” Explains Chalumuri.
Mobile performance
Alejandro Rioja of So Influential believes Mobile Performance report is critical for businesses to optimize their website for mobile.
“We use Mobile Performance Report because it’s great for understanding how well our site is optimized for the mobile devices and where we need to improve. For instance, if we see that the site is falling at a high bounce rate for android, our team gets busy in fixing the issue and optimizing the site speed.” Says Rioja.
Blog conversions
Alex Birkett of Omniscient Digital shares, “I love custom reports and use them all the time. One we always use and set up for our clients is a custom report that ties back conversions to which blog posts the session originated one. This is a very ‘direct response’ form of attribution, which doesn’t always work for content marketing, but since we’re typically creating high intent content and have aligned the post with a suitable offer, the goal is really to drive some form of conversion in that session.”
Mira’s Quincy Smith is a big fan of custom blog conversion reports, too. “We sell a few physical products and promote heavily across multiple channels, so attribution is HUGE for us. We’ve invested a lot into our blog over the past year and rely on a custom report to determine not only how much blog traffic is contributing to sales but also which pages are doing the heavy lifting. The report itself isn’t that complicated, but we check it weekly to ensure the amount of money we’re investing in content is driving sales.” Explains Smith.
Brand search
Jackie Jeffers of Portent Digital Marketing Agency uses custom reports to measure the strength of a client’s brand in search. “We evaluate landing pages, Source / Mediums, and search terms to determine what percentage of a client’s traffic is truly from familiarity with their brand. It really helps us understand which parts of “Direct” traffic are legitimate, and which parts are just traffic that Google isn’t able to classify in other channels.” Says Jeffers.
Mike Pavlak of StashStock uses custom reports for the same purpose.
“One example of a custom report on google analytics that we use is a graph that compares the length of a session on our website between paid and organic searches. We noticed that organic searches have much longer sessions than paid searches. To us, this means that we may need to restructure our landing page to be more informative and user friendly for those who are less familiar with our business. The bright side is that when people look for us, they find us and find what they need from us.” Shares Pavlak.
Campaign costs
Melanie Musson of CarInsuranceCompanies.net is a fan of Campaign Cost reports and explains, “It’s important to gain an overview of where your ad campaign investments are focused so that you can eliminate spending where you don’t see rewards and increase spending where your campaigns are doing well.”
Visitor acquisition efficiency
Bernadett Dioszegi of Bannersnack recommends business owners and marketers to analyze the visitor acquisition efficiency analysis via Google Analytics.
Dioszegi explains, “In this report, you can find data about the efficiency and performance of each source of traffic. If you click on a specific source/medium, you will be able to see medium and campaign information. In this report, you can find acquisition, behavioral, and result metrics. This report is a great help in analyzing information about the traffic that is most valuable for your business, so it will be so much easier to revise your marketing strategy.”
Diabetes 365’s Matt Schmidt agrees and explains why. “This specific report shows us data such as total sessions, new visitors, and our specific goal conversion rates. You can even organize this by the traffic source and medium. Simply put, it’s a great report for those who really like to look at specifics.”
Editor’s Note: Google Analytics (Acquisition) dashboard template goes deeper into your Sources and reveals which marketing campaigns have been most productive.

Events
“One custom report that our team uses is Events by traffic source. Our team uses numerous custom events (click engagement, scroll rate, contact for submissions). We then layer in the channels so that we can accurately see what channel is providing us with our “soft-conversions” (on a specific page).
This report is invaluable to our team since we can really see where our valuable content is.” Says William Chin of Weedloverz.com.
Akash Makwana of Franking Machine Compare uses custom event reports to label external link clicks. “This gives the business a better idea around how traffic is flowing around the site, where users are engaging the most, and how to shape our traffic better.
We’ve learned how to get a more granular view, and this informs our content strategy for new posts.” Explains Makwana.
Social referrals
Arfa Nazeer of Shemeansblogging uses a custom dashboard for Pinterest referrals for her website. “I can use that dashboard to find out which posts drive traffic from Pinterest. It even shows the live posts from Pinterest. I check that every week to find out the progress of Pinterest traffic and my top pins that drive traffic.
By using this custom dashboard for Pinterest, I have found out what type of content performs well and which type of posts doesn’t do well. This certainly helps me plan my content strategy for Pinterest.” shares Nazeer.
Top movers
“One custom Google Analytics report that is especially helpful for digital publishers and media brands is a ‘biggest movers’ report to see which pages have seen the most volatility in overall traffic for a given period of time, to help identify site issues, emerging trends, and any ramifications for search algorithm updates and changes.” Explains Matt Arceneaux of TechJunkie.
Map overlay
Catriona Jasica of Top Vouchers Code says, “Our team uses the map overlay custom report type in Google Analytics; by doing so the team is able to learn about the traffic sources, the audience ratio based on genders, the age demographic, and other viable information which helps us to tune up the site according to consumers inherent tastes.”
Browser
“My favorite custom report is a custom browser report. Websites lose an insane amount of traffic because not everybody uses Google Chrome or Safari, believe it or not. You can create a report that breaks down traffic per browser and then breaks it down per device (computer, laptop, smartphone, etc.)
This is a very powerful way to use custom reporting in Google analytics. You’ll learn exactly where your traffic is coming from and how you can optimize for it.” Shares Jack Choros of Little Dragon Media.
Wrapping up
When you’re just starting out, it’s very tempting to track all the data available to you via Google Analytics. You don’t want to miss out on anything.
However, as time goes by, you start to understand that you’re not using most of that data and are wasting a lot of your precious time analyzing data that doesn’t help you with your business and marketing goals. This is why you need to start creating custom reports. Focus on the data that can help you optimize your business and create better, more targeted strategies.
So if you still haven’t dived into the world of custom reports, now’s the time to do so.
A how-to guide for setting up goals in Google Analytics
A how-to guide for setting up goals in Google Analytics
In another post, I’ve written about how to set high-level goals for digital marketing, this post shows how best to set them up within Google Analytics.
What is a goal in Google Analytics?
A goal is a record of a page you specify being viewed which shows that a visitor has engaged with your website showing interest in your products and services. Since you can group goals in Google Analytics, I recommend you group in a logical way. This example shows one suggestion for a grouping.
Which goals should I use?
Different types of goals include to think about including are:
1. Leads from signup such as a whitepaper download or contacts us
2. Site engagement goals which show time on site, these are most useful for a publisher, but
3. Top of funnel product engagement goals – if you can encourage site visitors to view product-related pages they’re closer to buying, so you should assess the success of the site in getting visitors to these types of goals: product search page viewed, category page viewed or product page viewed.
4. Sales goals related to adding to adding to basket and sales. These often aren’t setup for retail sites and perhaps not essential Ecommerce tracking is setup separately. But you do need a sales goal to view your checkout funnel.
5. Social engagement and participation goals. These include: blog comments; product comments, reviews and ratings; favouriting or sharing of pages through social bookmarking and clicks through to a social presence like Facebook, Twitter or Linked In<.
Reasons to use goals in Google Analytics?
I find that often goals aren’t set in Google Analytics since they do require some configuration. So it will need some time to set them up. How do you justify this? For me, setting up goals in Google Analytics is indispensable for any business looking to get the most from their digital marketing since you:
- go beyond measuring visits to events happening on the site that show that customers have engaged with your business
- can track the value the site is generating for your business from these events
- see which traffic sources you’ve invested marketing in give rise to these goals
- review which content types and customer journeys on the site are helping achieve the goals
This example from agency Pauley Creative shows how different types of goals can get contributions from different marketing channels:

How do I setup goals in Google Analytics?
I’ve seen many cases when goals aren’t setup the right way although the form is quite straightforward. Here are the steps I recommend plus some tips of the common traps to avoid.

First Step. Enter Goal information.
- Goal name. Straightforward, but be as explicit as possible to make it obvious to others what it refers to, so don’t make it too short.
- Active Goal. Again straightforward, set to On for goal information to be collected
- Goal Position. Choose from one of 4 sets as shown in the earlier image. It helps to plan goals and group them logically as the example above shows. I have often seen that goals grow organically if this doesn’t occur.
- Goal Type. This will usually be the default of the URL destination like the thank you page after the page has been downloaded
Second Step. Goal details.
This is where it starts getting tricky and where mistakes are commonly made, so think this through carefully.
- Match Type. This tells Google Analytics to record a goal for a condition when the page viewed by the site visitor matches your goal URL. Several options are available here to give you flexibility to match a single URL which is most common for a thank you page after a form submission or a range of pages such as product pages. Generally, you are best to avoid the “Exact match” option since this could exclude pages, for example with additional tracking parameters in the URL query string to a landing page. Instead, use a “head match” which will include the first part of a URL and page name, but if there are other parameters such as ?campaign_id=email then the page will still be included. Remember that confusingly, the match type also effects what the URLs for the third step of the goal funnel, so check what you chose works here also.
- Goal URL. For a “thank you page” this will simply be the web address of the landing page. If you want to include several pages within a head match, it could be the first part of the URL, for example, http://domain.com/category-pages. Including a trailing slash page/ can exclude URLs without a trailing slash, so it’s best not to include this to capture all goals.
- Case Sensitive. Generally it is best to avoid the case sensitive option since this may exclude some pages.
- Goal Value. This is often not set, but as we have explained, it’s best to apply it for major goals such as leads from brochure downloads since it will five you an idea of the differences in value generated through different traffic sources (through the Goal Value per Visit metric) and different page types (through the $Index value metric). Ideally, you should base the value on a known calculation of conversion rate from lead to sale with an average order value. Even if this isn’t possible, setting a lead goal to an arbitrary value of £10 can be useful to understand value.
Third Step. Goal funnel
Here you enter a series of up to 10 URLs to explain the number of a steps in a conversion process such as check out. If you have more than 10 steps you may as well give up and go home, but it does happen…
In a brochure download, contact us or enewsletter signup page, this is relatively straightforward. You need to specify a single URL which is the signup form page, so simply specify this URL.
The only complexity is the “Required Step“ check box. This is usually left unchecked, but you can use it if you only want to show visitors that included this point in the funnel. It is most commonly used to make the first step in the funnel mandatory. But confusingly checking Required Step doesn’t affect the number of goals recorded, only the funnel visualisation.
Mistakes to watch out for
As a summary of the common errors I have seen made, finally here are some common mistakes to avoid:
Gotchas 1. The match type also applies to the funnel care, so take care if using exact match
Gotchas 2. Not actually the URL start with /<page>
Gotchas 3. Including a trailing slash / can exclude URLs without a trailing slash, so it’s best not to include this to capture all goals.
Gotchas 4. Missing/wrongly assigning goal value. You know we’re keen on assigning values to key goals.
Gotchas 5. Required step may exclude some behaviour e.g. entry deeper into funnel and cause confusion in the funnel visualisation.
I hope this post helps encourage more folks to use goals. Please share your experiences of how you setup goals or any details. Some of you may notice I haven’t mentioned the need for virtual page views to track some types of goals, I think that’s an issue for another post.
@import url(https://clickety-clack.click/wp-content/plugins/siteorigin-panels/css/front-flex.min.css); #pgc-117923-0-0 { width:61.8034%;width:calc(61.8034% – ( 0.38196600790794 * 30px ) ) } #pgc-117923-0-1 { width:38.1966%;width:calc(38.1966% – ( 0.61803399209206 * 30px ) ) } #pl-117923 .so-panel { margin-bottom:30px } #pl-117923 .so-panel:last-child { margin-bottom:0px } #pg-117923-0.panel-no-style, #pg-117923-0.panel-has-style > .panel-row-style { -webkit-align-items:flex-start;align-items:flex-start } @media (max-width:780px){ #pg-117923-0.panel-no-style, #pg-117923-0.panel-has-style > .panel-row-style { -webkit-flex-direction:column;-ms-flex-direction:column;flex-direction:column } #pg-117923-0 > .panel-grid-cell , #pg-117923-0 > .panel-row-style > .panel-grid-cell { width:100%;margin-right:0 } #pgc-117923-0-0 { margin-bottom:30px } #pg-117923-0 { margin-bottom:px } #pl-117923 .panel-grid-cell { padding:0 } #pl-117923 .panel-grid .panel-grid-cell-empty { display:none } #pl-117923 .panel-grid .panel-grid-cell-mobile-last { margin-bottom:0px } }