RESOURCES
- Reports
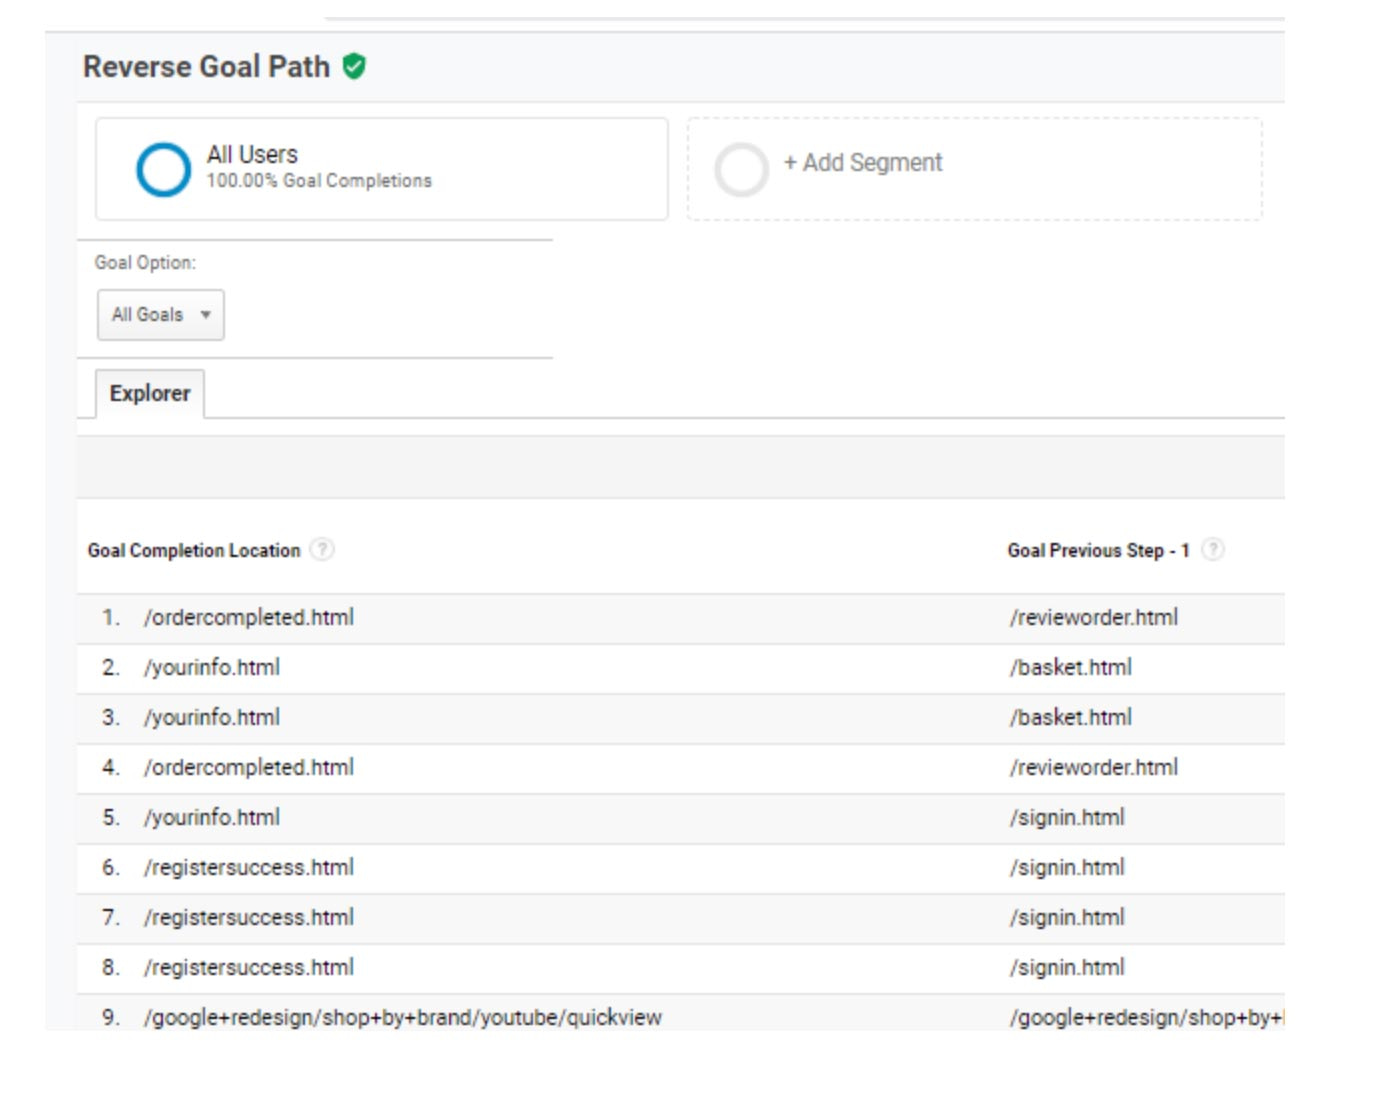
- Funnel Visualization : Conversions > Goals
- https://www.optimizesmart.com/the-geek-guide-to-understanding-funnels-in-google-analytics/
- Types of Google Analytics Funnels
There are 4 types of funnels available in Google Analytics:- Goal funnel it is a series of web pages which you expect your website users to follow, to complete a non-transactional goal like 'newsletter signups', 'downloads' etc
- Sales funnel it is series of web pages which you expect your website users to follow, to complete a transactional goal like placing an order on the website. The checkout process is a good example of a sales funnel.
- Multi-channel goal funnel it is a goal funnel that takes into account, the role played by multiple marketing channels in the conversion path.
- Multi-channel sales funnel it is a sales funnel that takes into account, the role played by multiple marketing channels in the conversion path.
-
Apart from above mentioned funnel types, we also have strict funnels and flexible funnels. Find out more about them below:
Strict funnel: In this type of funnel, you would like the user to follow the exact same steps that you have mentioned while creating a funnel. They cannot skip or miss any step. For example:
Home Page > Product Page > Add to Cart > Checkout Page
In the example above, the users need to follow the exact same steps. The user has seen the product page and went straight to the checkout page, there are no other steps in between.
This type of funnel is mainly used to highlight the drop off points in an idealized journey.
Flexible Funnel: In a flexible funnel, a user can take any paths or steps before they complete a purchase. Because not everyone follows the same path, they may like to view the product reviews, compare it with other products or may also like to add more products to the cart.A user may still satisfy a flexible funnel criterion as long as they hit some defined pages in their journey. For example:
Home Page > Product Page > Product Review Page > Category Page > Product Detail Page > Cart > Checkout Page
At some point, visitors must visit the steps in bold but they can fulfil the funnel requirements no matter which pages they visit in between.
To learn more about multi-channel funnels, read the article: Google Analytics Attribution Modeling _ Beginners Guide: https://www.optimizesmart.com/attribution-modeling-google-analytics-ultimate-guide/
In order to get the most out of goals and sales funnel, you need to know three things:- How to correctly set up goals/sales funnel
- How to accurately interpret/read the funnel visualization report.
- How to optimize the goals/sales funnel to increase sales.
-
Common Issues while Setting up Funnels in Google Analytics
Following are the most common issues I have discovered while setting up funnels in Google Analytics
- Selecting the wrong conversion path
- Not using descriptive names for funnel steps
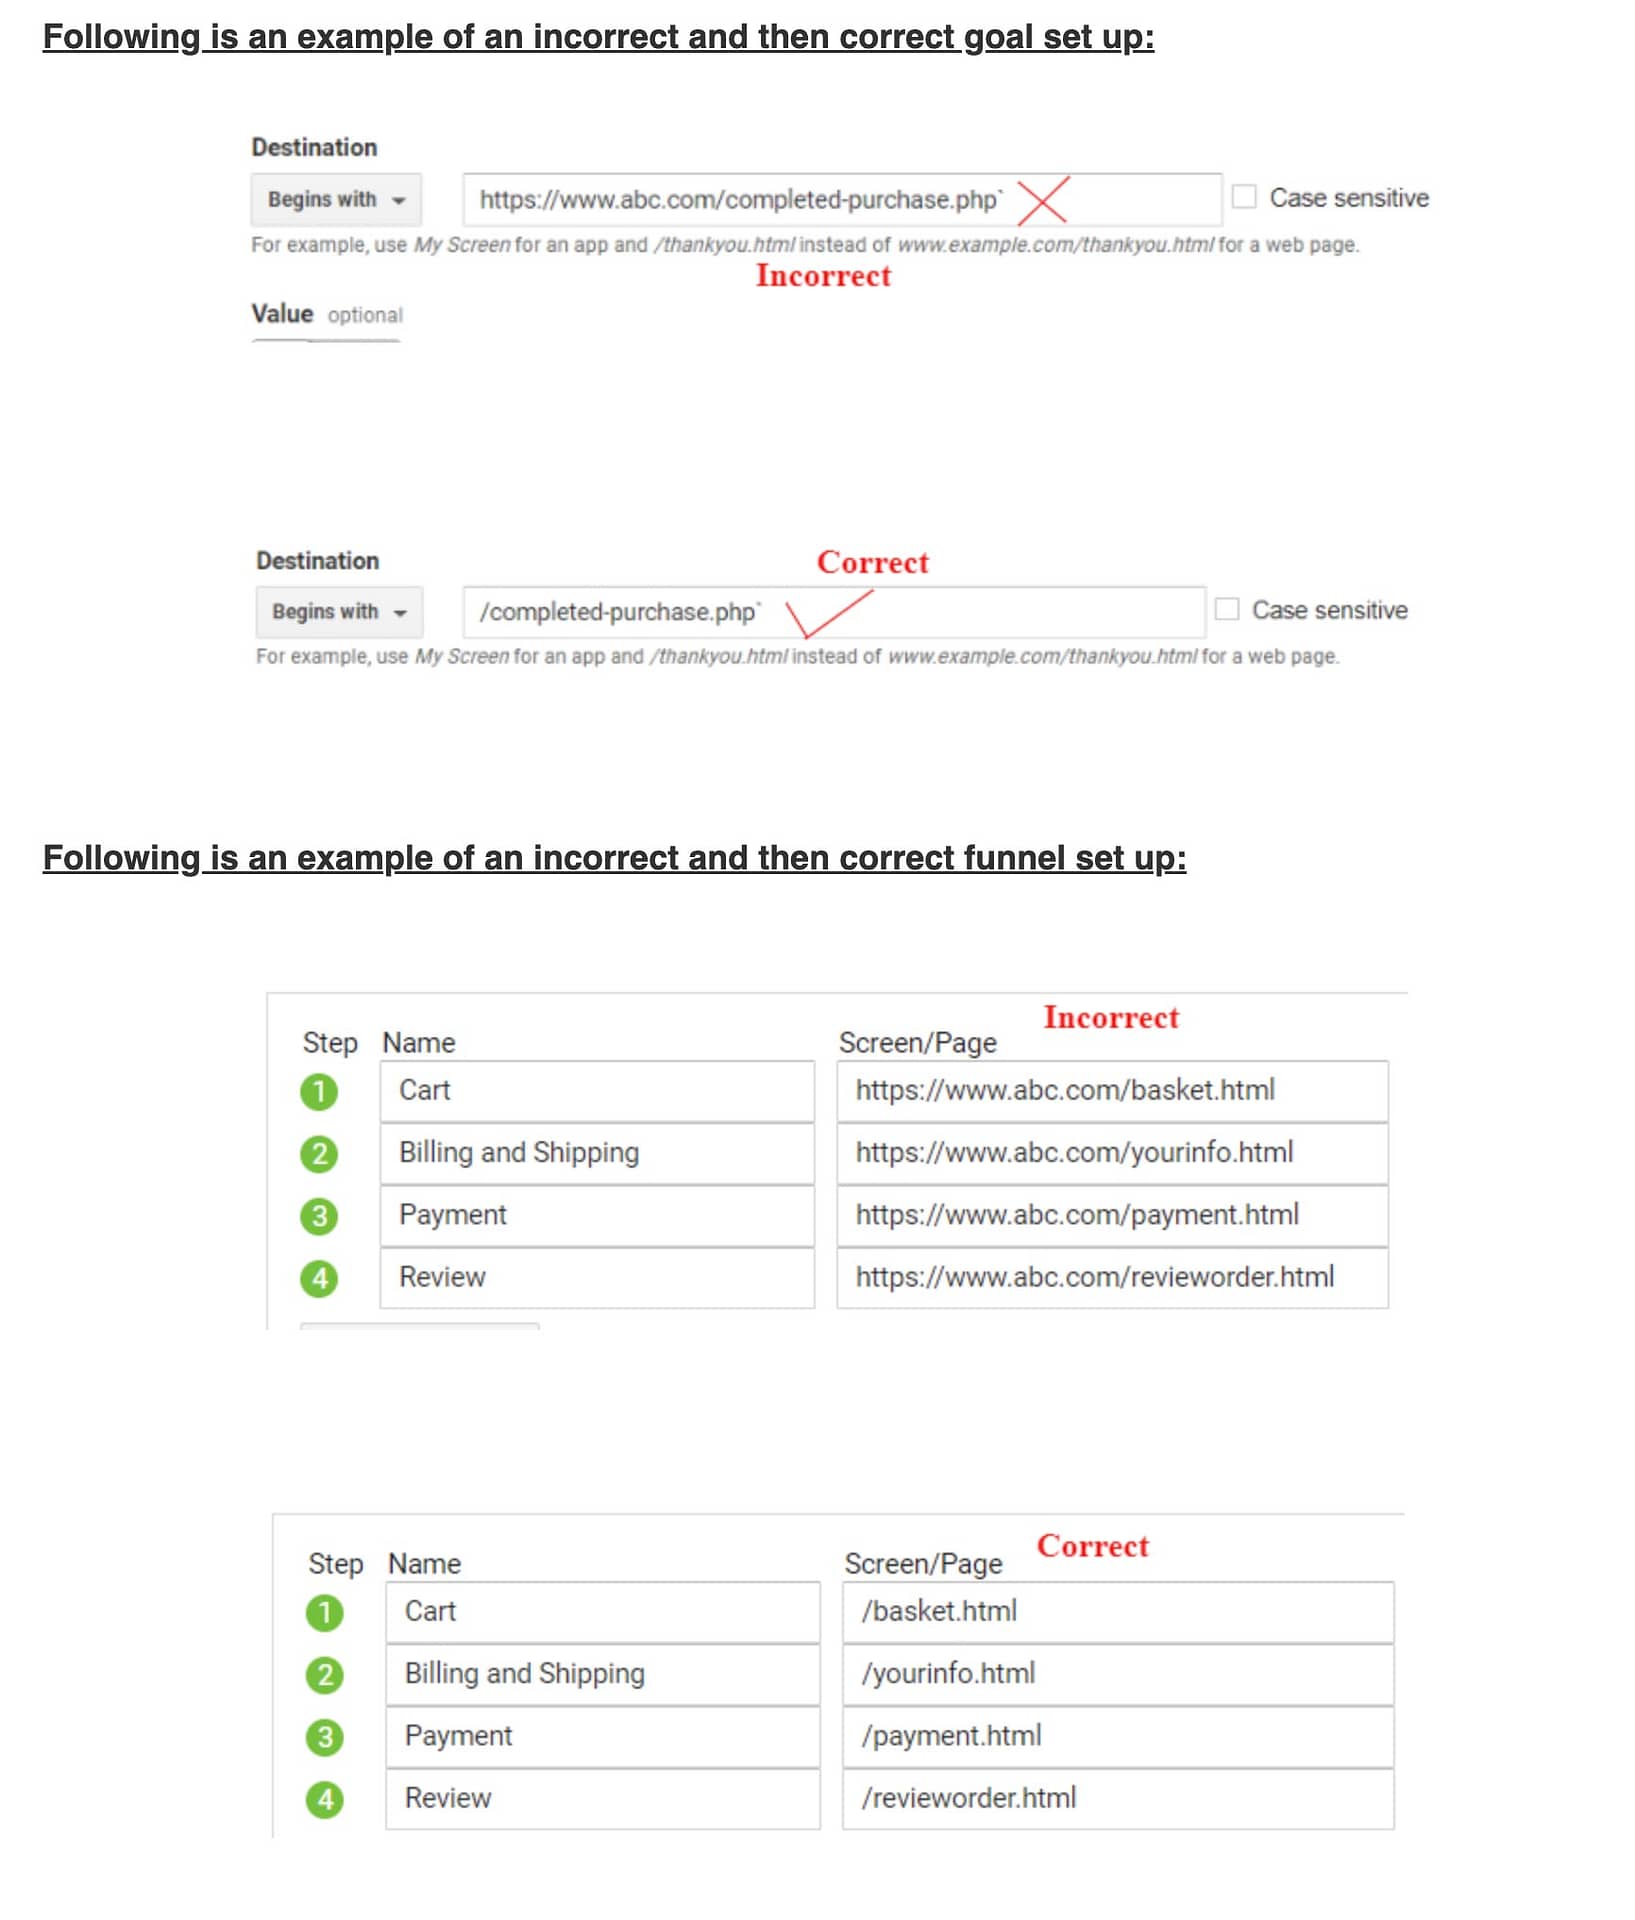
- Entering incorrect data while defining goal and funnel pages
- Using the same goal page for different funnels
- Capitalization issues
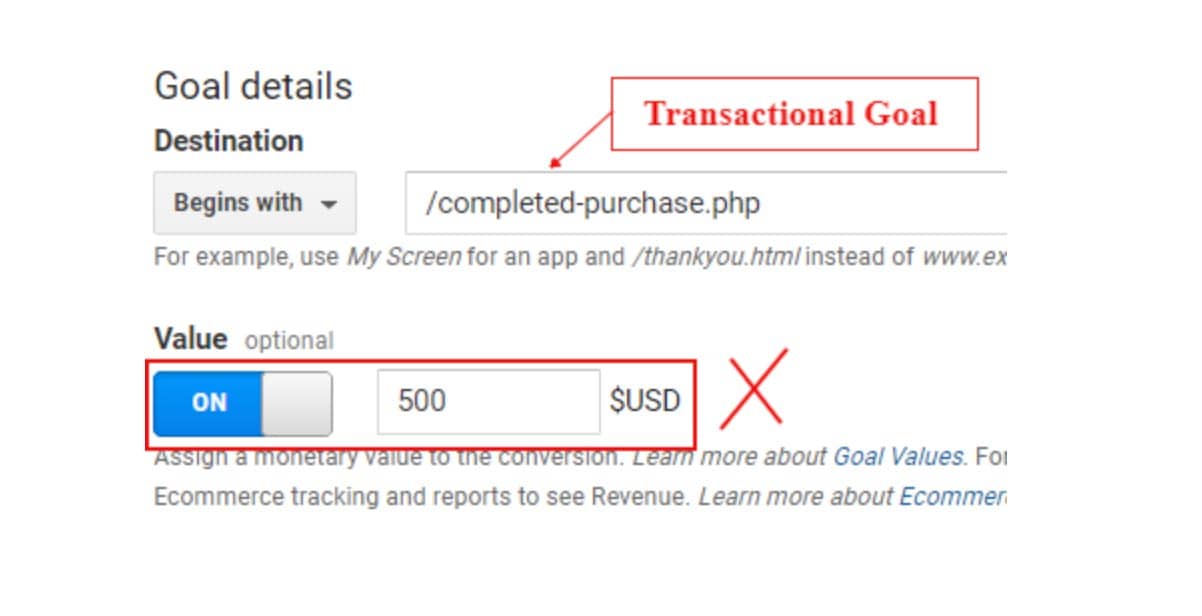
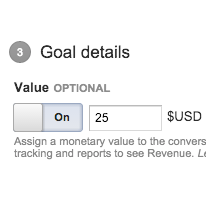
- Assigning a monetary value to transactional goals
- Using incorrect REGEX (regular expressions) for Goal and Funnel Pages
- Not understanding the required first step
When you mark the first step of the funnel as required, the funnel visualization report includes only those conversions that pass through the required step: - Not Testing the Funnel Setup
- Selecting the wrong conversion path
-
- Keep the following points in mind while interpreting the funnel visualization report:
-
#1 The funnel visualization report does not report on users but unique pageviews.
#2 The funnel visualization report does not always show the actual order in which the funnel pages were viewed.
#3 The funnel visualization report does not show loopback.
#4 Funnel Visualization Report shows continuation only from the funnel pages.
#5 Google Analytics reports the funnel pages in the order they were set up, not in the order they were actually viewed.
#6 Funnel Visualization Report can show multiple unique pageviews for a single user.
#7 The funnel visualization report can backfill certain skipped funnel steps #8 Users repeating a goal funnel in a single GA session does not alter the conversion count.
#9 Users repeating the sales funnel alter the conversion count
#10 The funnel visualization report shows data only going forward
#11 The date comparison feature of GA doesn’t work on funnel visualization report
#12 You cannot segment the funnel visualization report via custom segments
#13 Always Segment the Google Analytics Funnel Data before you interpret it.
#14 The funnel visualization report can suffer from data sampling issues
#15 Avoid using small time frame or small data sets for your funnel analysis.
#16 There is no impact of funnel steps on conversion rate and conversion volume
#17 The funnel conversion rate is not the same as the goal conversion rate or ecommerce conversion rate.

https://www.wpromote.com/blog/analytics/funnel-visualization-vs-goal-flow-google-analytics
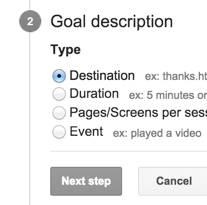
Whether you’re an ecommerce site looking to sell widgets or a blog looking to get new subscribers, every website should have an end user’s goal in mind. If there is a logical path that users should follow before converting, you should definitely have funnels set up for Destination goals in Google Analytics so you can visualize how people are (or aren’t) converting. If you haven’t set up any goals yet, check out this article to get started.
Setting Goals
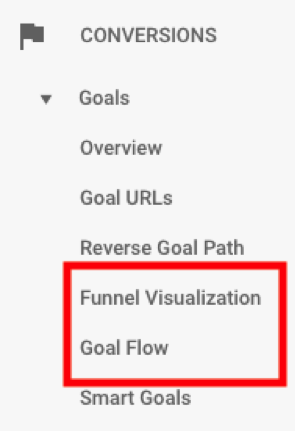
After you’ve set up Destination goals, you probably want to check out how people are moving within each step of your funnel. If you’ve already started analyzing your funnel, kudos to you! If you haven’t, you can start looking at your funnel by clicking on Conversions -> Goals.

Under the Goals tab, you’ll notice that you can analyze your funnel either through the Funnel Visualization or Goal Flow tab. Don’t worry though, we’ll go over both and help you decide which works best for you.
Funnel Visualization
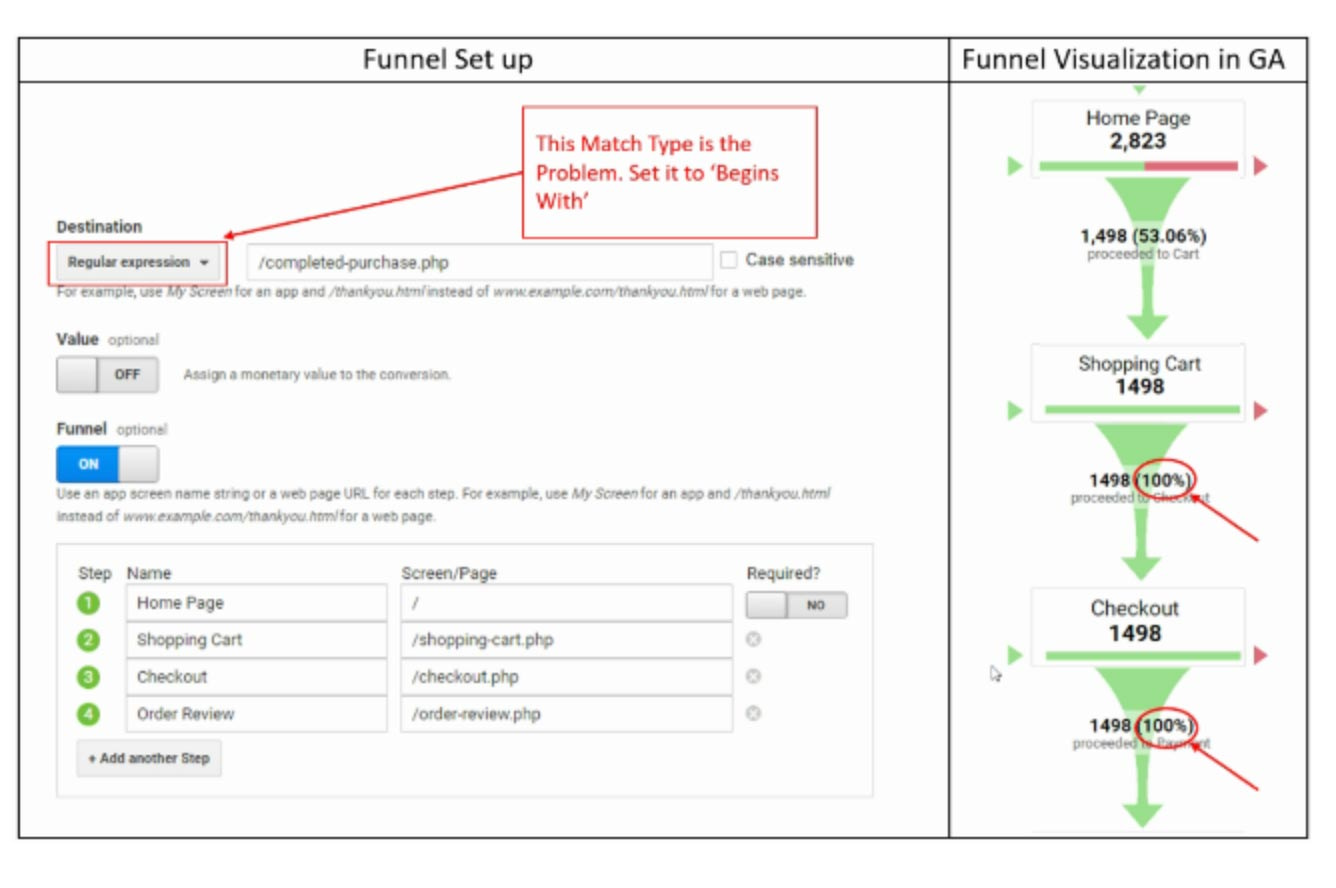
Let’s start with Funnel Visualization. When you create a Destination goal, you’ll be asked whether the first step in the goal is required. This step only affects the Funnel Visualization report and basically means that the conversion must have passed through the first step. In addition, the match type that you select for your goal URL (i.e. Regular expressions) also applies to the URLs in the following steps in the funnel.
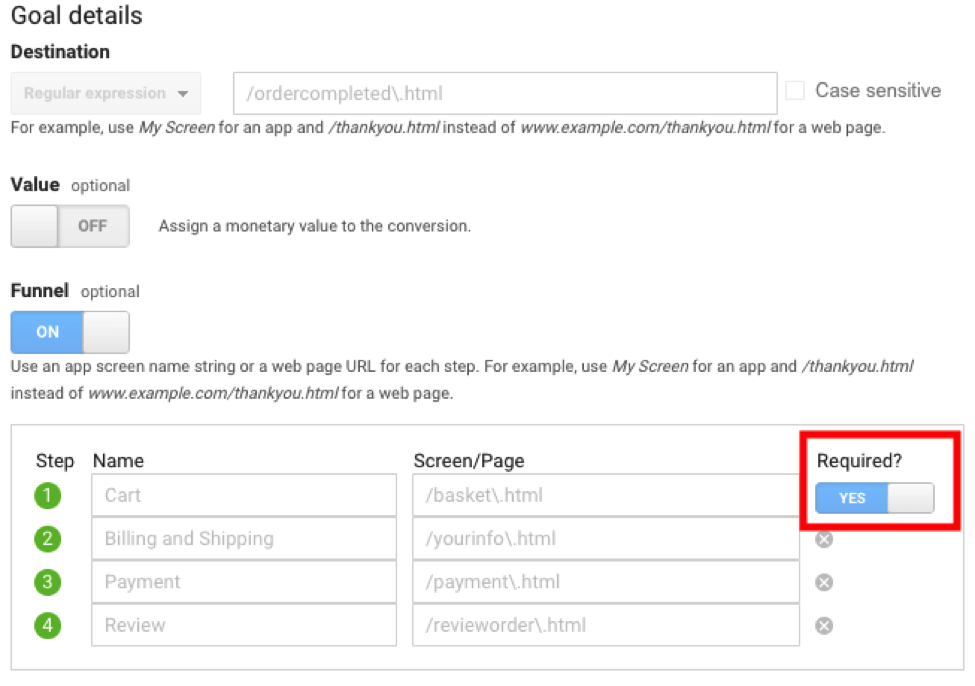
Any conversions that occur with the first step being skipped are dropped from the Funnel Visualization report (i.e. If a user starts with Step 2 and completes the funnel, the conversion will not be shown in the Funnel Visualization report). However, if the first step is not required and the user completes the funnel by skipping the first step, the step they entered into will be attributed as the starting step in the Funnel Visualization report and each subsequent step will be incremented by one. If your funnel does not have pageviews but requires multiple steps, then an advanced setup would be required.
Note that the steps in between are not required and that Google Analytics will backfill each step. For instance, if a user goes through the first step (or any step before the last step assuming there is no required first step) and skips directly to the last step, each step will get incremented by 1 in the Funnel Visualization report.
If a user is currently in the funnel and exits, the red arrow on the right of the funnel step will increment by 1. The number next to the arrow represents how many people in the funnel left in that step, and the Request URI in the table shows where the user went to. If the user went back to the previous step or refreshed the page, the Funnel Visualization report will show it as an exit to the previous page or a refresh to the current page. If you see a large number of exits at a particular step in the funnel, I recommend diving deeper into that particular step and figuring out what is causing users to leave in that particular step. The green arrow on the left of the funnel step shows where the user came from and will increment by 1 as well.

The (entrance) dimension means that that was the first step where the user first entered the funnel. If you start seeing the pesky (other) in the entrance or exit location, that means that there is an issue with sampling as the Funnel Visualization report shows up to 50,000 daily unique paths.
An important thing to note is that the steps in the Funnel Visualization report aren’t correctly attributed in the order of the visitor’s actual movements. For instance, consider a user going from the About Us page to step 3, then to step 2, and then exiting from step 2. Assuming there is no required first step, the Funnel Visualization report would show that the user came from the About Us page to step 2, and then to step 3, and exiting from step 3. Essentially, entrance to the funnel is assigned to the highest step in the visitor’s funnel path (i.e. step 2 rather than step 3) and the exit is assigned to the lowest step in the visitor’s funnel path (i.e. step 3 rather than step 2).
Some other important things to note are that the Funnel Visualization report does not allow for advanced segmentation analysis and the report does not show historical data. In addition, the conversion rate is the total number of sessions that entered the funnel divided by converted visitors, and if a user converts more than once per session, Funnel Visualization only increments one conversion.
Goal Flow
Goal Flow is a much more flexible report and allows for more complex analysis of your conversion funnel. For starters, the required first step doesn’t apply to the Goal Flow report so you can visualize every session that took part in your funnel and which step in the funnel they started on.
By adjusting the Level of Detail scale all the way to the right, you can see how different traffic sources (or any dimension you want to analyze) started and traversed in your funnel. This is particularly useful when you have marketing campaigns running and want to see how that traffic is moving within the conversion funnel. Just click on the dimension node (the technical word for each visual step) you want to analyze and click “Highlight traffic through here.” Doing so will highlight that particular dimension in the visual funnel and the table below. This will help you see the conversion rate in each step of the funnel and not just the entire funnel.
Note that the lines above the nodes show how the traffic is moving forward through the funnel, the lines below show how the traffic is looping back, and the red lines show where the traffic dropped off. Compared to the Funnel Visualization report, the Goal Flow report shows where users have looped back to previous steps, as well as the actual order of steps the users took. In addition, if the user goes from step 1 to step 3, step 2 will not be backfilled. This is particularly useful when analyzing your funnel and see if any steps aren’t necessary or are being overlooked by users.
The best feature of the Goal Flow report is the inclusion of advanced segments. By layering in any segment you want to hone in on, you can deeply analyze who your best converters are and figure out what your best (or worst) marketing channels are. Just like custom channel groupings, another neat feature is that you can do an analysis of historical data, while the Funnel Visualization report only works on future data.
Similarities Between Funnel Vision & Goal Flow
Now that we know the differences, what are the similarities of both the Funnel Visualization report and Goal Flow report? Here are the 3 main things that are similar:
- Completed goals only count once per session, not each time a user completes the funnel
- Funnels may only be created for Destination goals.
- Depending on how the goals are configured, goals and pageviews might not match up.
Let’s wrap it all up now and figure out why these reports are important. In a business context, you ultimately want to see areas where you can optimize and get a bigger bang for your buck. By looking at which marketing campaigns and channels converted the most, you can do a deeper analysis and figure out why they converted and others didn’t. In addition, you can see which steps in the funnel are valuable and which are useless, as well as create custom audiences based on their funnel movement. I strongly believe that there is an inverse correlation between checkout friction and conversion rates so removing unnecessary steps in a conversion funnel should raise conversion rates.
In a nutshell, the deep level analysis that the Goal Flow report provides is really valuable for funnel analysis. For instance, the ability to apply advanced segmentation and the visualization of funnel steps are particularly strong features when analyzing your funnel. In contrast, although a strong feature of the Funnel Visualization report is the ability to add a required first step, you can just create an advanced segment in the Goal Flow report and only show users who have visited the first step. In my opinion, I’d stick with the Goal Flow report for reporting and analysis purposes.
The Takeaway
The Goal Flow report is a flexible funnel reporting system that allows for historical data analysis, advanced segmentation, and funnel analysis without backfilling, while the Funnel Visualization report is a rigid report that backfills and doesn’t account for the actual steps that the user took.